


Technical Outlook:
- EUR/USD on the verge of rolling over through support
- AUD/USD barely hanging on as channel could break
- DXY could soon rally to March low and beyond
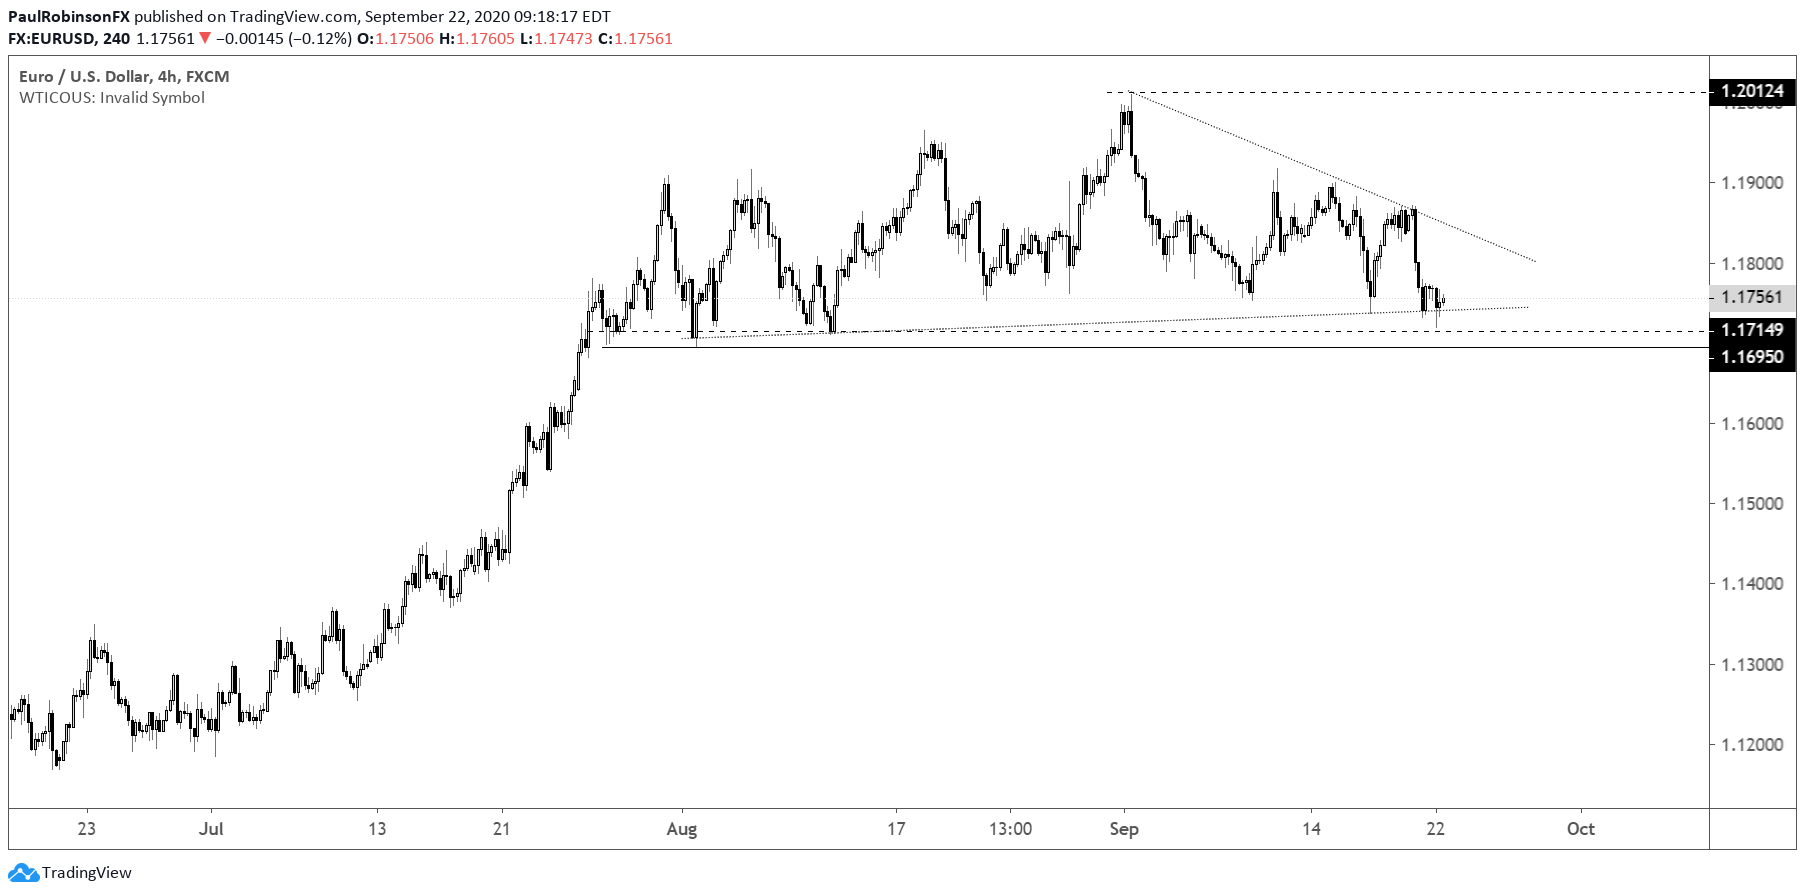
EUR/USD is on the brink of breaking support as the US dollar continues to look strong across the board. To get below all significant support price needs to break cleanly through 11695. From there it could drop quickly as it leaves behind the ranging price action. However, it needs to actually break support first – until it does it should be respected as support.

EUR/USD 4-hr Chart (watching 11695)
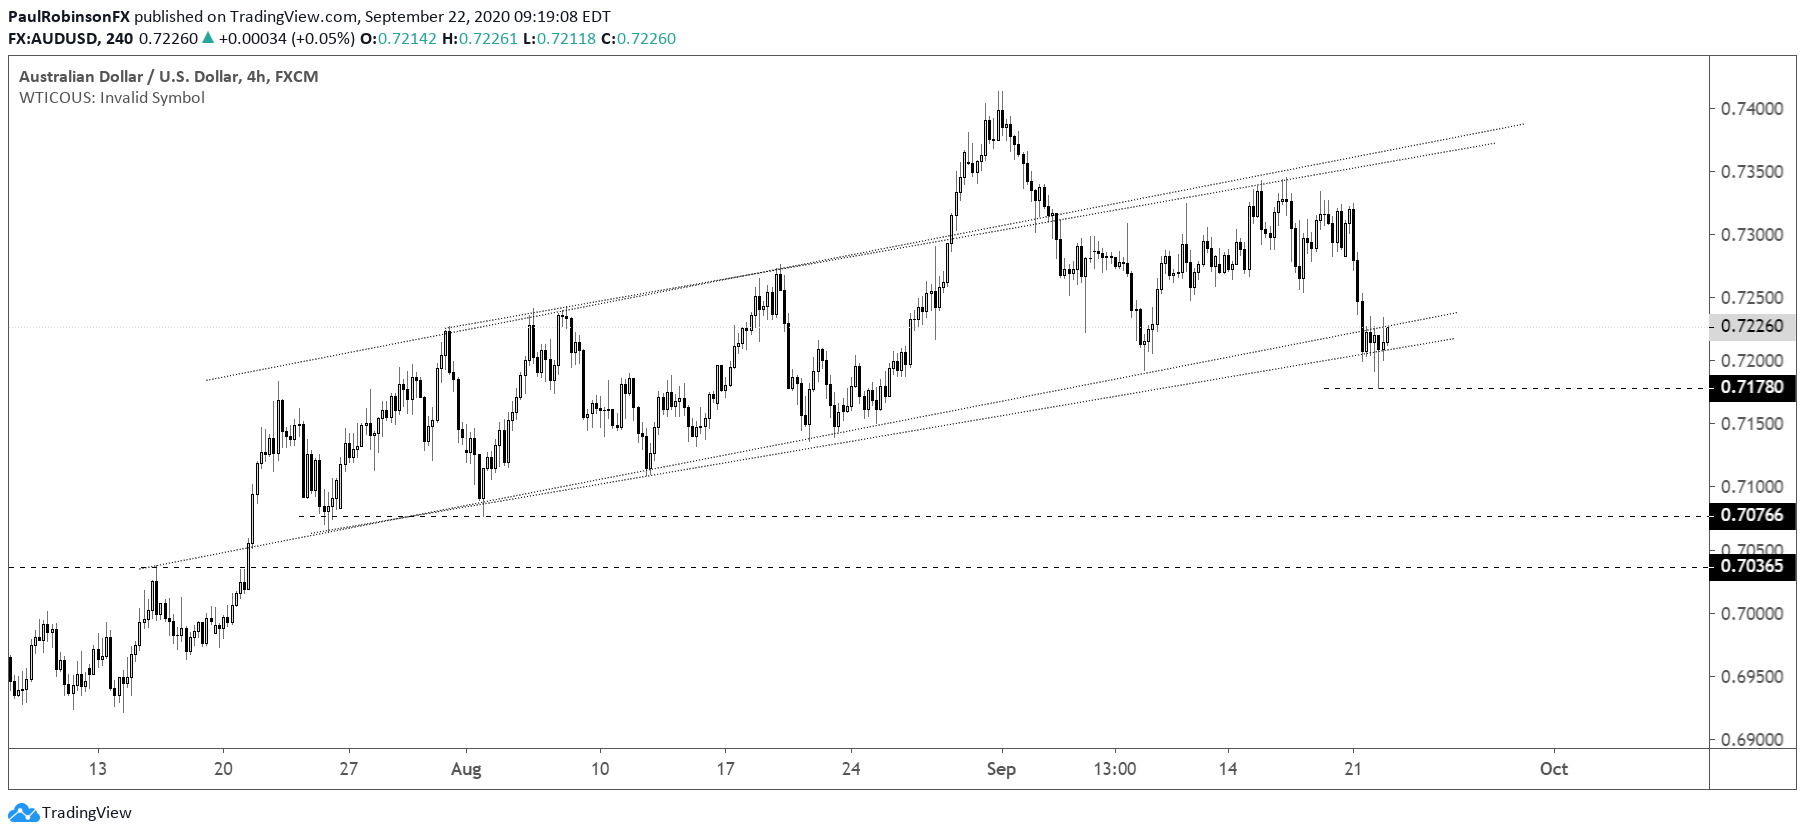
AUD/USD is also teetering on support, with it barely holding onto a channel. I’ve drawn it in with a couple of slight variations to allow for some wiggle room, but soon regardless of how it’s drawn the structure could be broken. A closing 4-hr candle into the 7160s should prove enough separation for downside momentum to pick up.
AUD/USD 4-hr Chart (could soon fall out of the channel)
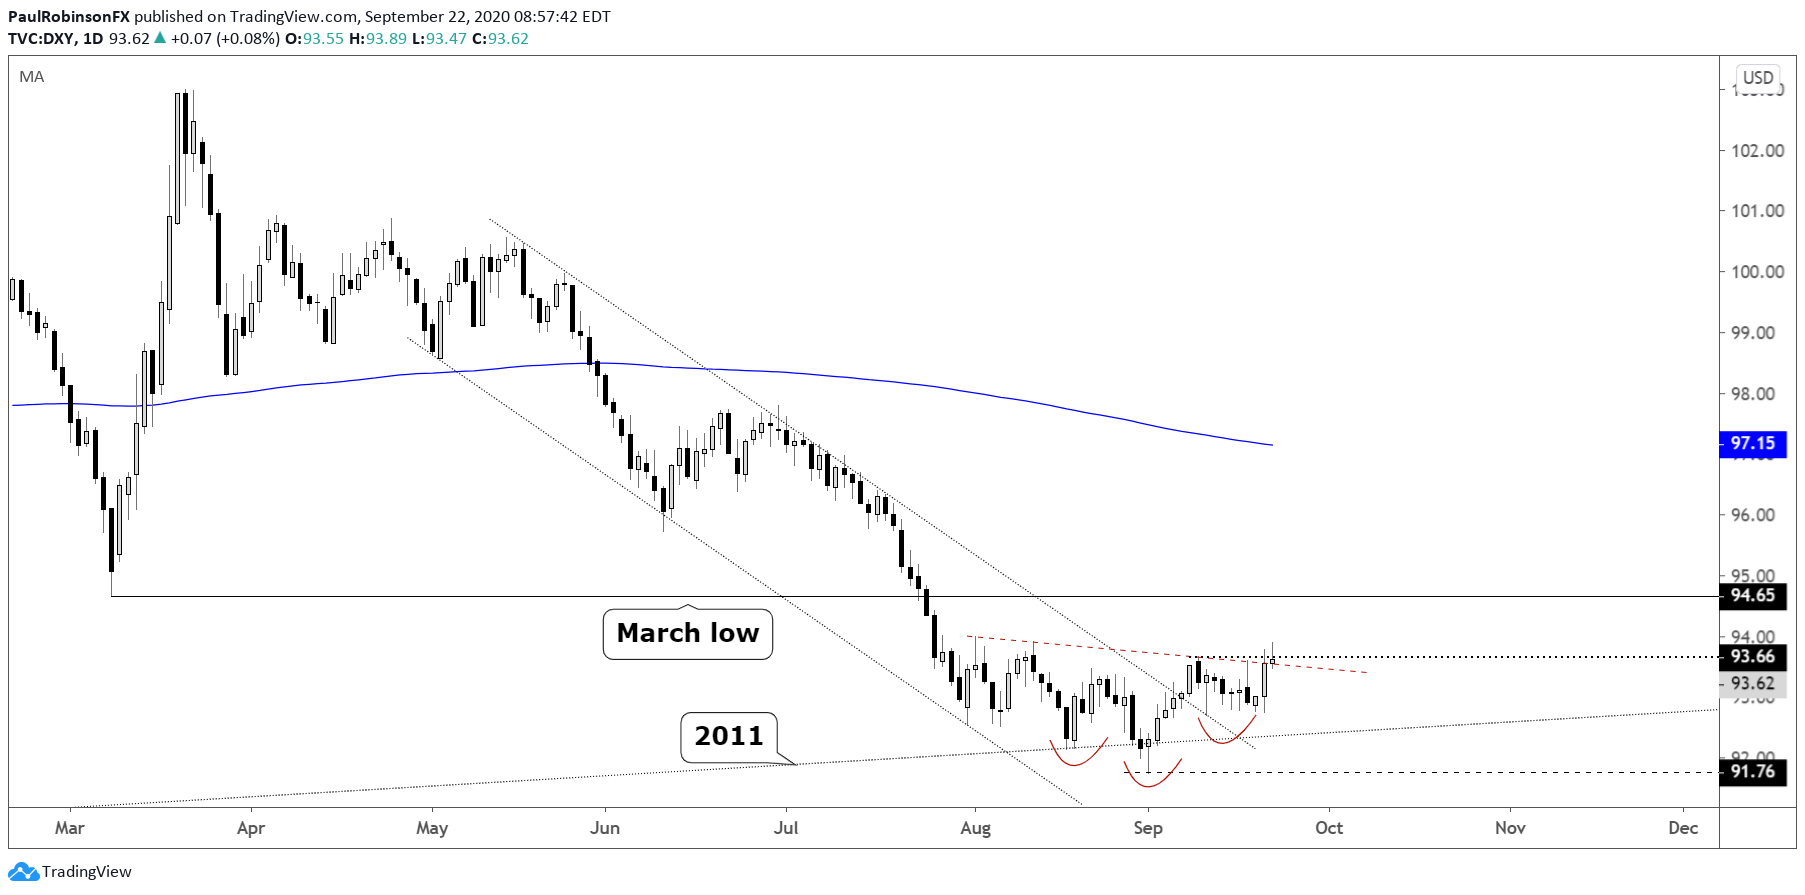
The US Dollar Index (DXY) is primarily run by EUR/USD as it makes up about 57% of the index. With that in mind, if the euro breaks the aforementioned support then the DXY should make good on its inverse head-and-shoulders pattern. The March low could quickly come into play at 94.65. Should the DXY rise to that point we will want to pay close attention to momentum for cues as to whether the significant low from the spring will matter as resistance or not.
DXY Daily Chart (could soon see the March low and higher)
U.S. Dollar Currency Index (DXY) Chart by TradingView
For all the charts we looked at, check out the video above…
Resources for Forex Traders
Whether you are a new or an experienced trader, DailyFX has several resources available to help you; indicator for tracking trader sentiment, quarterly trading forecasts, analytical and educational webinars held daily, and trading guides to help you improve trading performance.
---Written by Paul Robinson, Market Analyst
You can follow Paul on Twitter at @PaulRobinsonFX


