


British Pound Outlook, GBP/USD, GBP/JPY, EUR/GBP – Talking Points:
- GBP/USD rates at risk of further declines as price hovers precariously above the 200-day moving average.
- Break of pivotal chart support suggests GBP/JPY may extend its 9-day fall from the monthly high.
- EUR/GBP rates could pullback in the coming days before eventually resuming their climb towards the yearly high.
The British Pound’s six-month surge from the doldrums of March appears to have run its course, as no-deal Brexit fears and climbing cases of Covid-19 threaten to upend the United Kingdom’s nascent economic recovery. Moreover, bearish technical setups on multiple GBP crosses hint at further losses for the politically-sensitive currency.
GBP/USD Daily Chart – 200-DMA Last Line of Defence

GBP/USD daily chart created using TradingView
From a technical perspective, the GBP/USD exchange rate appears to be gearing up to extend its recent 9-day slide from the yearly high (1.3483) set on September 1, after price collapsed through Rising Wedge support to fall back to the sentiment-defining 200-day moving average (1.2744).
With the RSI teetering above oversold territory and the MACD indicator sliding below its neutral midpoint, the path of least resistance looks to be lower.
Moreover, the negative slope of both the 21- and 50-DMA’s hint at swelling bearish momentum, which could ultimately drive price back towards confluent support at the April high (1.2648) and uptrend extending from the May low (1.2183) if the 200-DMA is unable to stifle selling pressure.
Conversely, a short-term recovery could be on the cards if price can climb back above the June high (1.2813), with a close back above the August low (1.2981) and 50-DMA (1.2960) probably carving a path for price to retest the March high (1.3200).
| Change in | Longs | Shorts | OI |
| Daily | 3% | -7% | -3% |
| Weekly | 4% | -10% | -5% |
GBP/JPY Daily Chart – Break of Pitchfork Support Hints at Further Declines

GBP/JPY daily chart created using TradingView
The outlook for GBP/JPY rates is also relatively bearish given price was unable to remain constructively positioned above confluent support at the 61.8% Fibonacci (136.95) and Schiff Pitchfork parallel.
That being said, a potential recovery back towards the psychologically pivotal 137 level could be in the offing if support at the 135 level continues to suppress selling pressure and buyers are able to push price back above the sentiment-defining 200-DMA (136.90).
However, with the RSI and MACD indicators both falling below their neutral midpoints and into bearish territory, it seems relatively unlikely that GBP/JPY will make a sustained climb back towards the monthly high (142.71).
To that end, a resumption of the primary downtrend may eventuate in the coming days if price is unable to climb back above the 200-DMA, with a daily close below the 135 level probably clearing a path for GBP/JPY to retest support at the 78.6% Fibonacci (133.75).
| Change in | Longs | Shorts | OI |
| Daily | 1% | -3% | -1% |
| Weekly | 13% | -31% | -17% |
EUR/GBP Daily Chart – Symmetrical Triangle Break Ominous For Bears
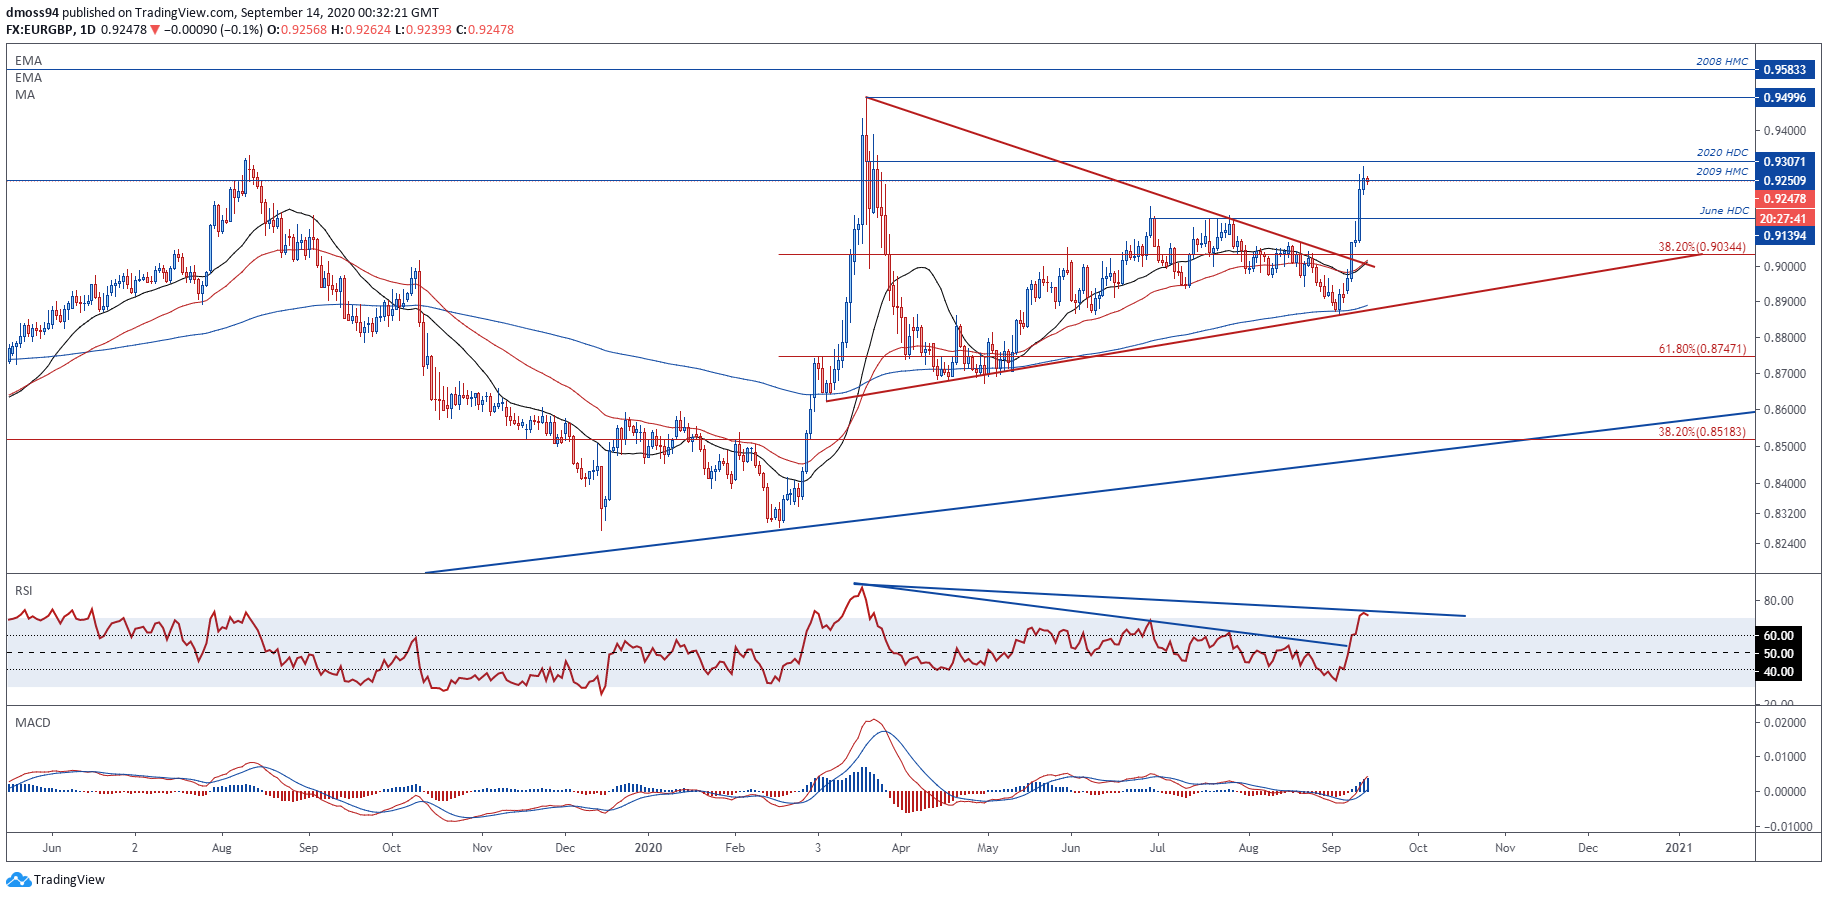
EUR/GBP daily chart created using TradingView
EUR/GBP rates look poised to retest the yearly high set in March (0.9499), after price sliced easily through Symmetrical Triangle resistance to fall just shy of the 2019 high (0.9324).
Having said that, a near-term pullback may precede the next leg higher as the RSI begins to slide back below 70 and price struggles to close above the 2020 high daily close (0.9307).
Therefore, EUR/GBP could retreat back towards support at the June high (0.9176) in the coming days before resuming its primary uptrend.
A daily close above the psychologically pivotal 0.93 level is needed to validate bullish potential and would probably bring the yearly high (0.9499) into play.
Conversely, a close back below the June high daily close could generate a more sustained pullback towards the 38.2% Fibonacci (0.9034) and 21-day moving average (0.9018).
| Change in | Longs | Shorts | OI |
| Daily | -4% | -2% | -4% |
| Weekly | -9% | 5% | -6% |
-- Written by Daniel Moss, Analyst for DailyFX
Follow me on Twitter @DanielGMoss


