


NASDAQ 100, HANG SENG, FTSE 100 INDEX OUTLOOK:
- Nasdaq 100 index extended losses, dragging the US stock market sharply lower
- Hong Kong’s Hang Seng Index saw big selling in tech stocks at the inclusion of Alibaba and Xiaomi
- UK’s FTSE 100 index may also retrace but at a relatively smaller magnitude
Nasdaq 100 Index Outlook:
Nasdaq 100 index futures extended losses at Asia open after falling over 4% on Tuesday. Tesla shares tumbled 21%, marking the worst single-day performance recorded, weighing on the broader tech sentiment. A significant retracement in technology shares came with no surprise, as warning signs were given – rich valuation, deviation from the other sectors, US-China trade spat, and rising volatility.
For now, the tech pullback seems more like a technical correction in a mid-term bull market, as there are no material changes observed in the fundamental picture. The US stock market has perhaps over-run and may see a pullback. A technical correction usually ranges between 5-20% in magnitude, beyond which signals a bear market.
The next question will be, to what extent will this tech correction impact the broader markets such as bonds, precious metals, currencies and non-tech stocks? The answer is it depends.
The US Treasury yield curve was little changes from a week ago, and gold prices remained fairly composed. This might suggest a lack of evidence for systemic risk, at least for now.
Crude oil prices, however, suffered a 7% decline as the US Dollar strengthened. The risk-sensitive AUD/JPY pairfell to a two-week low of 76.4, signaling that currency traders are prioritizing for safety.
Non-tech stocks may also see spillover effects from tech selling and move lower in Asia-Pacific and European trading sessions today.
Sector-wise, all eleven S&P 500 sectors closed in the red (table below). Information technology (-4.59%), energy (-3.71%) and financials (-2.59%) were among the worst performers. Only 9% of the S&P 500 index components ended higher.
S&P 500 Index Sector performance 9-9-2020
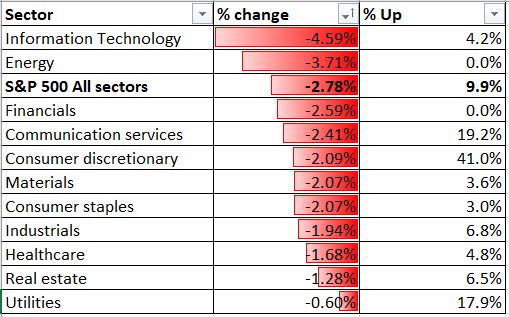
Source: Bloomberg, DailyFX
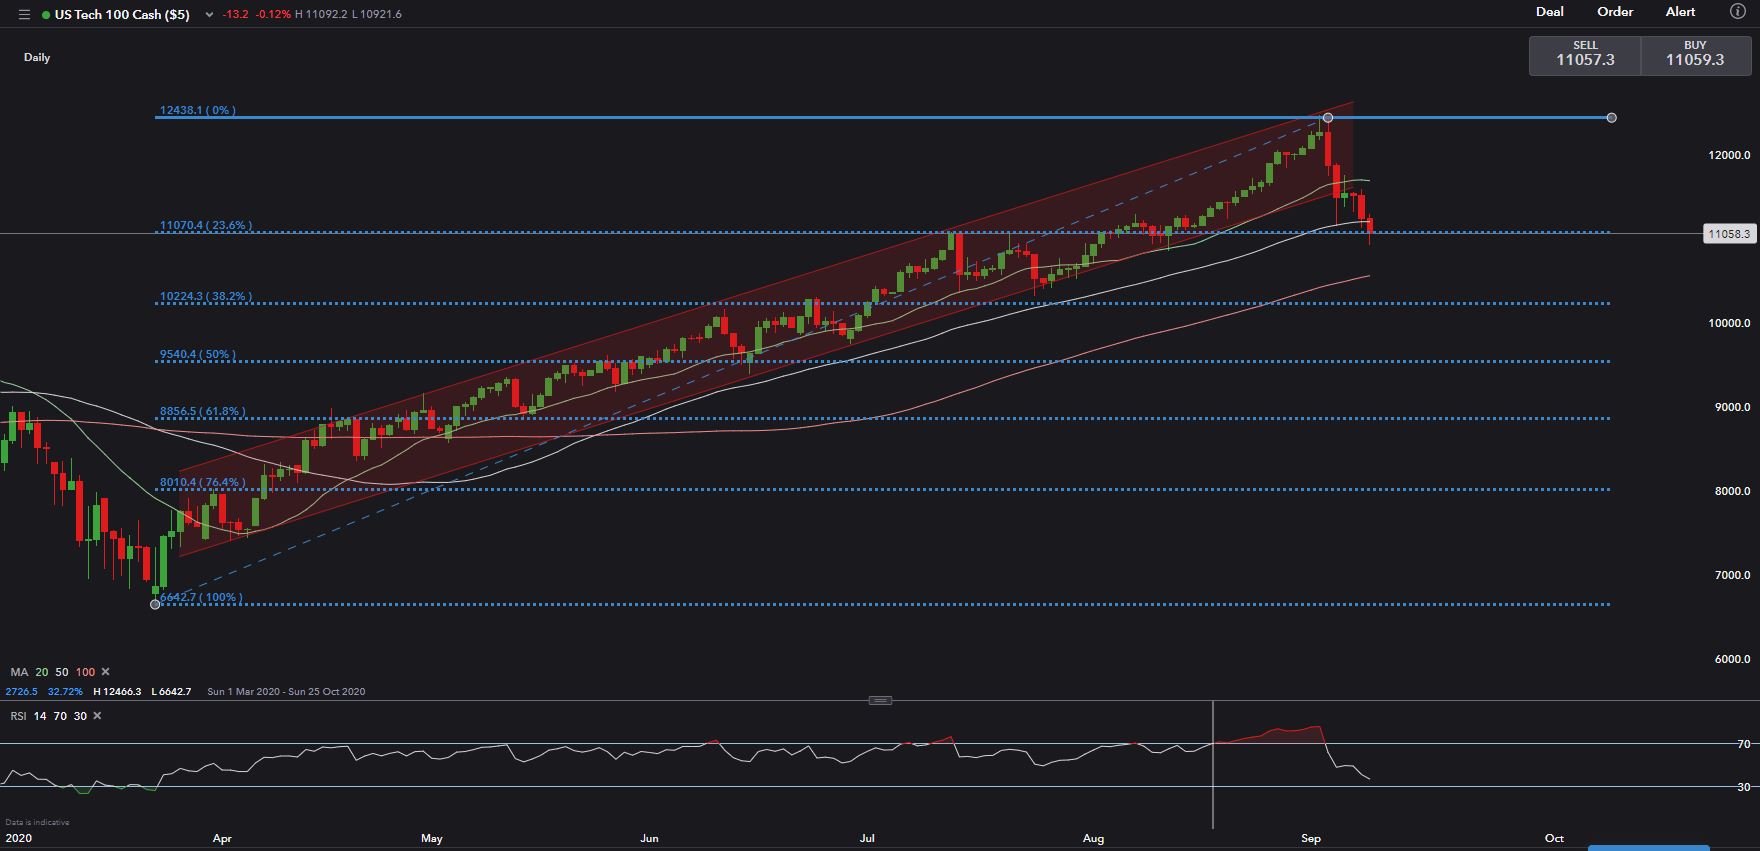
Technically,the Nasdaq 100 has broken its “Ascending Channel” on Wednesday and thus has opened the room for more downside towards 11,070 – the 23.6% Fibonacci retracement level. A deeper correction may bring it to test the next key support level at 10,220 – the 38.2% Fibonacci retracement. Its near-term momentum seems to be bearish-biased. The RSI indicator has swung sharply lower to 38, but has yet to reach oversold territory below 30.
Nasdaq 100 Index – Daily Chart
Hang Seng Index Outlook:
Hong Kong’s Hang Seng Index (HSI) opened lower following a bloodbath US trading session. During early Wednesday trade, it was down over 1.3%. Chinese technology giants Alibaba (9988 HK) and Xiaomi (1810 HK) are officially added into the Hang Seng Index on 9th Sep 2020, which will significantly change the index’s tech weight. Both stocks were sold off heavily due to the recent tech rout and an escalation in US-China trade spat.
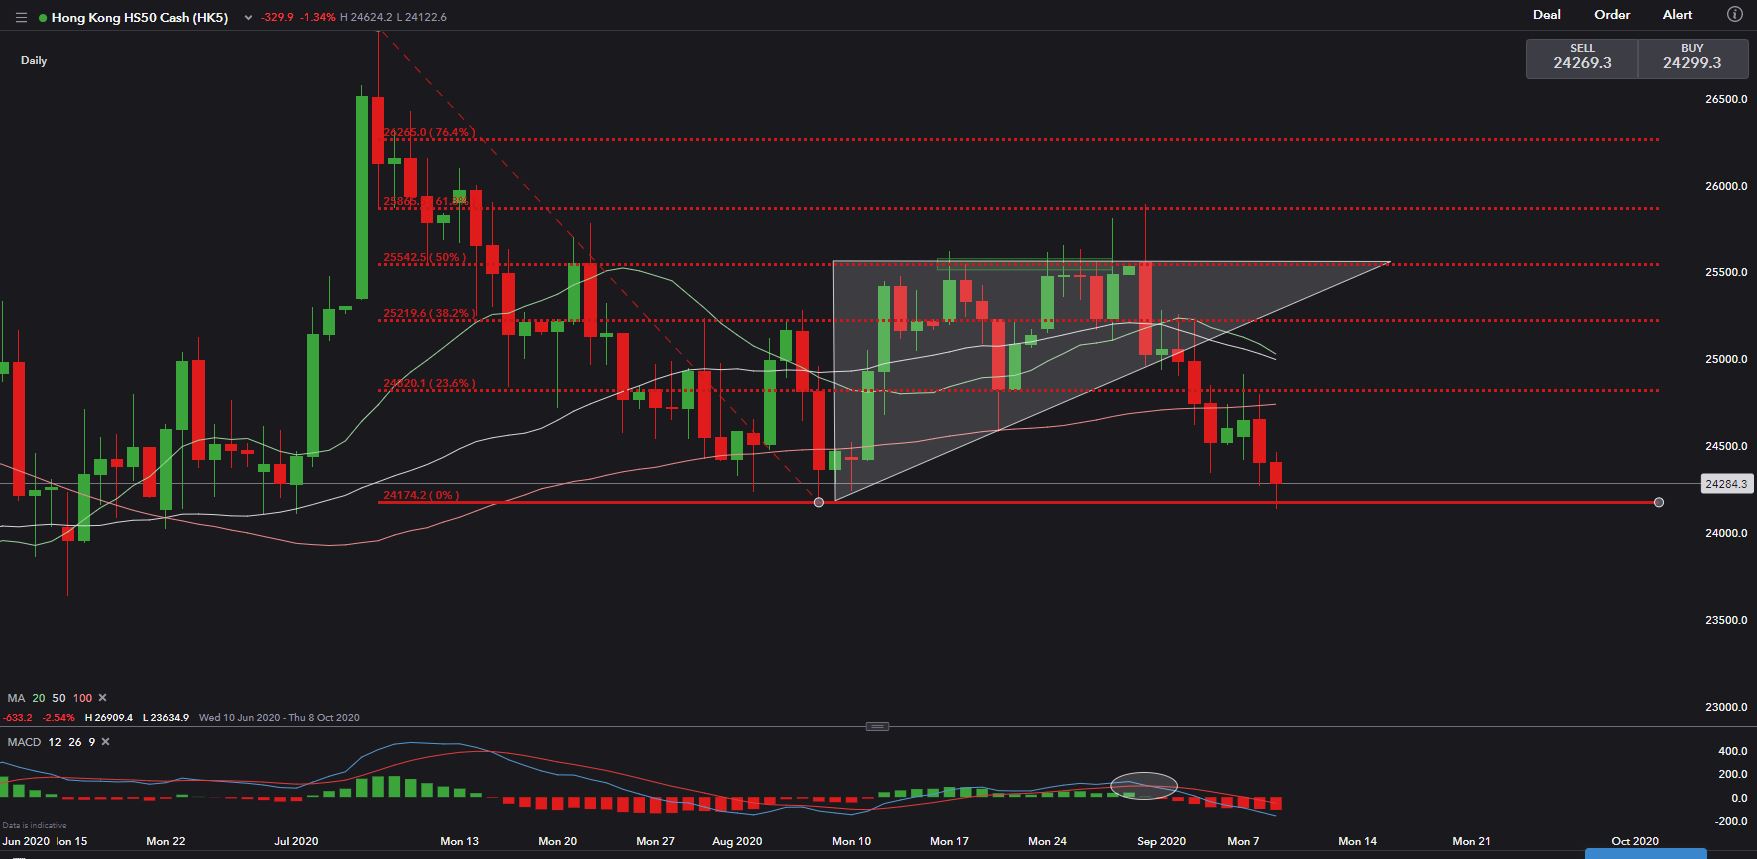
Technically, the HSI fell into a bearish trend recently. Its immediate support level can be found at 24,170 – the previous low seen in early August 2020. Breaking this support will open room for more downside towards 24,000 and then 23,500. The MACD indicator has turned firmly into the bearish zone, suggesting near term momentum biased towards the downside.
Hang Seng Index – Daily Chart
FTSE 100 Index Outlook:
Technically, the FTSE 100 index has tested an immediate support at 5,800 and has since rebounded. Its immediate resistance level can be found at 6,127 – the 50% Fibonacci retracement. Near-term momentum seems to be biased towards the downside, as its 20- and 50-Day Simple Moving Average (SMA) lines have formed a “Death Cross”. Compared to the Nasdaq and other US stock indices, selling in the European stock markets was much milder recently.
FTSE 100 Index – Daily Chart


--- Written by Margaret Yang, Strategist for DailyFX.com
To contact Margaret, use the Comments section below or @margaretyjy on Twitter


