


EUR/USD Price Forecast:
- EUR/USD held hostage by psychological level
- MACD trapped in oversold territory
- Price action remains faithful to key Fibonacci support
Visit the DailyFX Educational Center to learn about Technical Analysis and more
Amid a global economic crisis, the EUR/USD pair is conflicted as political and economic woes rise. After four consecutive months of strength, EUR/USD has retraced as USD weakness subsided.. With just eight weeks left before US elections, US-China tensions continue to rise, and with pressure mounting on many other economies.. Meanwhile, Europe is preparing for a no-deal Brexit and the ECB meeting on Thursday, 10 September 2020 should be an additional driver for price action.
From a technical standpoint, after four consecutive months of gains, the EUR/USD has stumbled with bulls unable to push through the 1.2000 level. This has allowed for EUR/USD price action to pull back into a key area of support, aided by a Fibonacci retracement level.
The EUR/USD weekly chart below highlights Fibonacci retracements from two major moves. The first Fibonacci retracement (pink) is plotted between January 2017 low and February 2018 high, while the second Fibonacci retracement (blue) represents the more immediate move, between 03 August 2020 (low) to 31 August 2020.

EUR/USD Weekly Chart

Chart prepared by Tammy Da Costa, IG
Since the end of July, price action has been trading in a confluent zone between the 38.2% and 23.6% Fibonacci retracement level of the medium-term move, with bulls unable to push through the psychological level of 1.2000.
MACD Remains in Oversold Territory
In the interim, the EUR/USD four-hour chart below now highlights how price action continues to flirt with the 76.4% retracement of the immediate move at 1.17693 while the above-mentioned Fibonacci levels have helped to provide support and resistance for the pair.
EUR/USD 4 Hour Chart
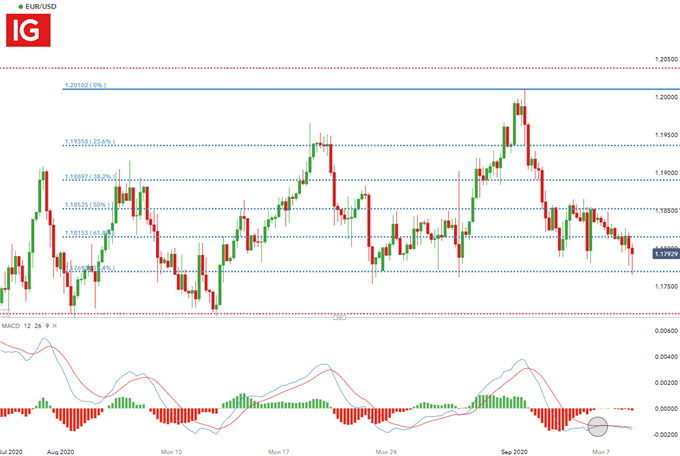
Chart prepared by Tammy Da Costa, IG
Meanwhile, the MACD remains below zero, a possible indication that major currency may be in oversold territory.
For price action, should price action break through the psychological level of 1.1800, upward momentum may increase until the next level of resistance at 1.2000.
--- Written by Tammy Da Costa, Market Writer for DailyFX.com
Contact and follow Tammy on Twitter: @Tams707


