


USD/CAD Analysis
- Potential for both bulls and bears
- Oil supply and demand economics may have a long-term bearing on USD/CAD
- Unemployment data in US and Canada could provide much needed stimulus
- IGCS supports uncertainty with mixed signals
Visit the DailyFX Educational Center to discover more on why news events are essential to FX fundamental analysis
WILL THE CAD RALLY CONTINUE WITH FUNDAMENTAL DRIVERS ON THE HORIZON?
Depressed crude oil inventory figures has led to a rise in Canadian Dollar (CAD) strength of recent despite broader US Dollar gains – oil being one of Canada's major exports. With stronger Canadian manufacturing data oil may well see an increase in demand which could extend the longer-term CAD gain.
This past week has seen price consolidating around the 1.3000 and 1.3100 levels. Market participants may be waiting for a suitable catalyst to give the pair a directional stimulus.
USD/CAD: WEEKLY CHART
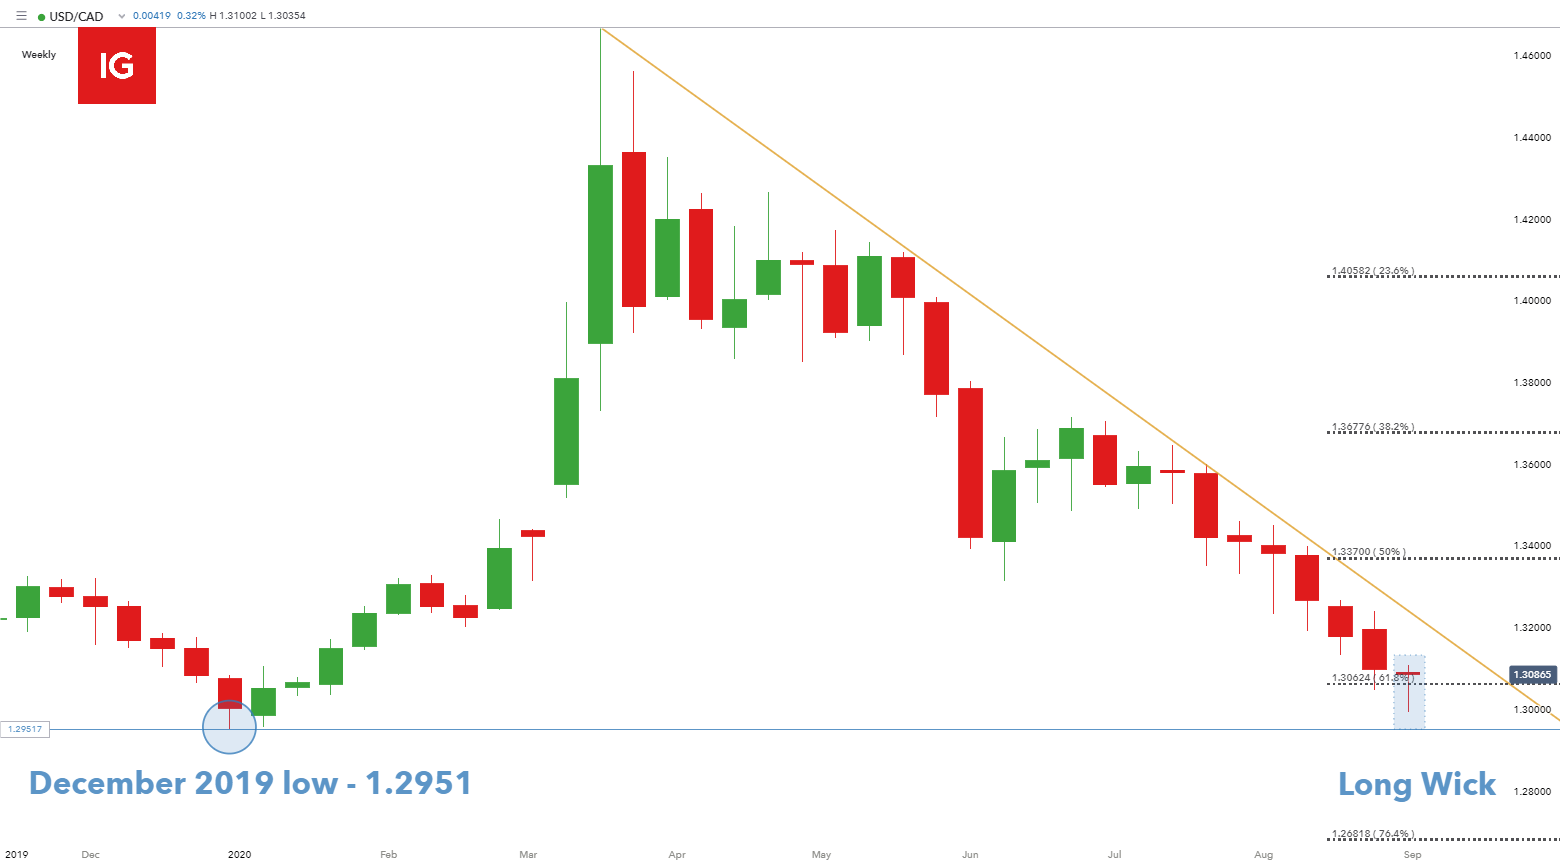
Chart prepared by Warren Venketas, IG
From March 2020 highs, USD/CAD has fallen roughly 11.42% to recent September lows. Price action shows an attempt to test the December 2019 support low (1.2951) but was cut short at 1.2994 by defensive bulls. This resulted in a long wick candle formation (blue) on the weekly chart above which could indicate a possible bullish reversal. The 1.3062 61.8% Fibonacci support zone remains as a significant area of confluence which may provide a base for either a continuation or reversal in momentum – Fibonacci taken from September 2017 lows to March 2020 highs.
USD/CAD: DAILY CHART
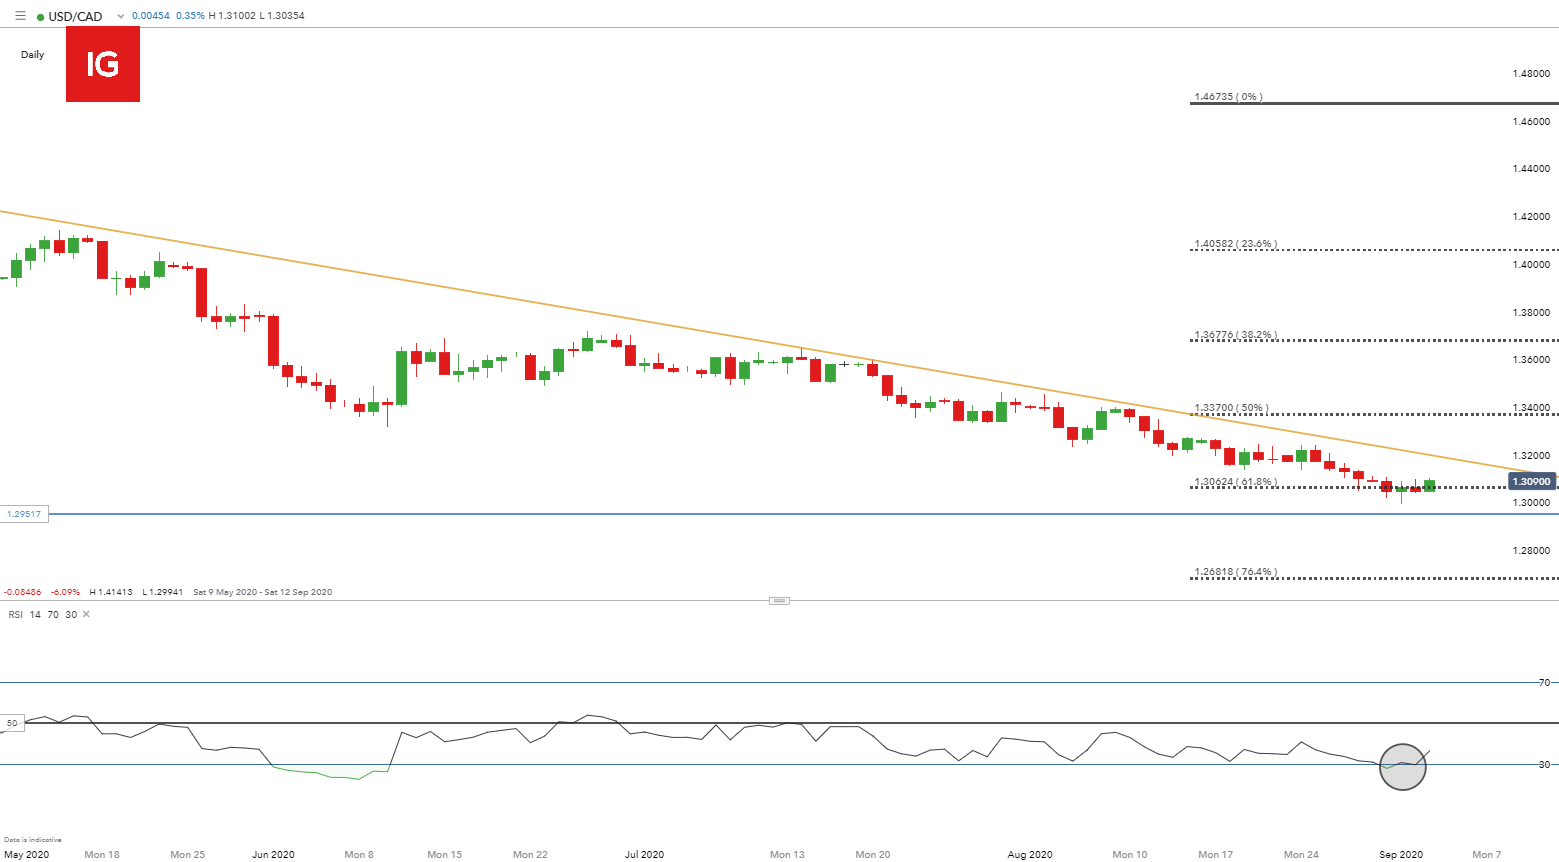
Chart prepared by Warren Venketas, IG
The Relative Strength Indicator (RSI) is well below the 50 level in oversold territory (black) which may align itself for a bounce off the 61% Fibonacci support (1.30624) up to trendline resistance (yellow). Trading against the trend can carry risk especially after such a formidable downward move. Bears can look for initial support at the 1.3000 psychological level with further additional support at the 1.29517 December 2019 low.
GLOBAL MANUFACTURING ‘RECOVERIES’ INDUCES SUPPLY AND DEMAND CONUNDRUM
With major importing countries increasing their oil volumes over recent months, particularly China, optimism around exporters has initiated an increase in supply after recent output cuts. Market participants may be overstating the recent increase in manufacturing figures globally. This may result in a supply glut as OPEC+ members boost outputs, which could dampen oil prices and take away from the strong USD/CAD downtrend.
Further your knowledge on oil and the importance it plays in financial markets with 8 Surprising Crude Oil Facts Every Trader Should Know
HIGH IMPACT EVENTS SCHEDULED FOR USD/CAD
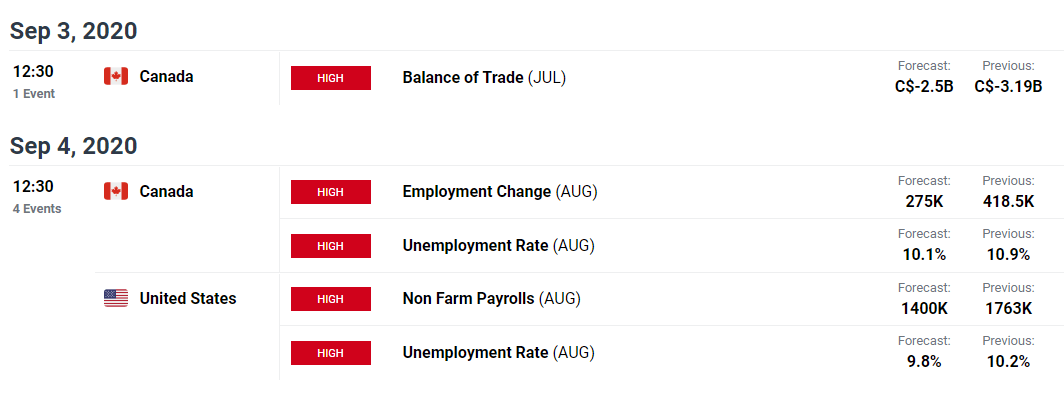
Source: DailyFX Economic Calendar
Important economic data releases listed on the economic calendar for today and tomorrow with the Balance of Trade (JUN) figures later today at 12:30GMT and unemployment data for both Canada and the US (NFP) tomorrow at 12:30GMT. It will be interesting to see how recent CAD strength has affected imports and exports.
Unemployment data tomorrow should give an indication of economic recovery from the global pandemic for the respective countries and any large deviations from expectations may prompt a significant move for USD/CAD. With Canadian manufacturing figures already showing improvement, this may well reflect positively for unemployment as well.

USD/CAD STRATEGY MOVING FORWARD
USD/CAD has been trading in a tight range this week which has not revealed any sort of short-term trend. Data releases today and tomorrow may well give the pair a push above or below support.
Key points to consider:
- 61.8% Fibonacci level – 1.3463
- Technical indicators – RSI oversold territory
- Oil inventories
- Upcoming economic data
- IGCS data
IG CLIENT SENTIMENT DATA REVEALS POTENTIAL FOR FURTHER DOWNSIDE
IGCS shows retail traders are currently prominently long on USD/CAD, with 69% of traders currently holding long positions (as of this writing). At DailyFX we typically take a contrarian view to crowd sentiment, and the fact traders are net-long is suggestive of a sustained bearish outlook however, with a higher net change in short positions relative to long positions by retail traders, the outlook is of a mixed disposition.
| Change in | Longs | Shorts | OI |
| Daily | -2% | 7% | 5% |
| Weekly | -30% | 38% | 13% |
--- Written by Warren Venketas for DailyFX.com
Contact and follow Warren on Twitter: @WVenketas


