FTSE 100 Price, Chart and Analysis:
The latest Nationwide house price data showed UK property reversing losses seen in May and July, hitting a fresh all-time high. The 2.0% m/m increase in August followed a 1.8% increase in July with the trend ‘set to continue in the near term, further boosted by the recently announced stamp duty holiday, which will serve to bring some activity forward’, according to Nationwide chief economist Robert Gardiner. The forecast, however, suggests labour market conditions weakening significantly in the quarters ahead, dampening housing activity. UK builders popped higher on the release with Barratt Developments (BDEV) +6.2% and Taylor Wimpey (TW) +4.3%.
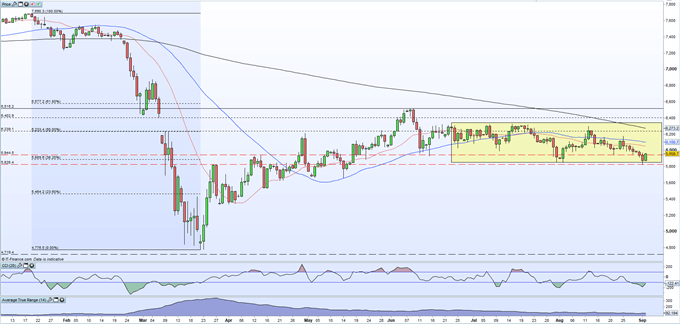
The FTSE 100, aided by the bounce back in building stocks and a weaker Sterling, pushed around 1.5% higher and bounced off its recent multi-week support level. The UK big board has been range bound since early-mid June and has underperformed other global indices. The daily chart shows that the FTSE is oversold (CCI) although further gains will likely be tempered by the 20- and 50-day moving averages at 6,054 and 6,101 respectively. Above here, 6,176 would likely be the next level of resistance. While the indices just broke through support yesterday, it would need a break and open below here to leave the May 14 swing-low at 5,650 vulnerable. Further range consolidated looks likely in the days ahead.
Find Market Turning Points with Support & Resistance


FTSE 100 Daily Price Chart (January – September 2, 2020)

EU trade negotiator Michel Barnier is scheduled to give an update on the EU/UK trade talks at 13:00 UK today with both sides seemingly far apart on fisheries and level playing field status. Both sides continue to stick to their respective ‘red lines’ and unless a compromise is found soon, the very best outcome that may be available is a very basic Free Trade Agreement with ongoing discussions in the months/years ahead.
Also today, a pair of Bank of England MPC members, deputy governor Bill Broadbent (15:30 UK) and chief economist Andy Haldane (16:30 UK) will be speaking and their comments need to be closely followed. For all economic data releases and market-moving events, see the DailyFX Economic Calendar
Client Sentiment Suggest Lower Prices
IG client sentiment data shows that retail traders remain heavily long of the FTSE with traders 5.48 to 1 net-long versus net-short. We typically take a contrarian view to crowd sentiment, and the fact traders are net-long suggests FTSE 100 prices may continue to fall.
The latest data shows that traders are further net-long than yesterday and last week, and the combination of current sentiment and recent changes gives us a stronger FTSE 100-bearish contrarian trading bias.
| Change in | Longs | Shorts | OI |
| Daily | -30% | 25% | 2% |
| Weekly | -44% | 44% | 0% |
Traders of all levels and abilities will find something to help them make more informed decisions in the new and improved DailyFX Trading Education Centre
What is your view on the FTSE 100 – bullish or bearish?? You can let us know via the form at the end of this piece or you can contact the author via Twitter @nickcawley1.


