


DOW JONES, ASX 200, STRAITS TIMES INDEX OUTLOOK:
- The Dow Jones Industrial Average rose on upbeat macro data, while VIX continued to nudge up
- The ASX 200 Index is eyeing on the release of 2Q GDP figure after losing 1.7% yesterday
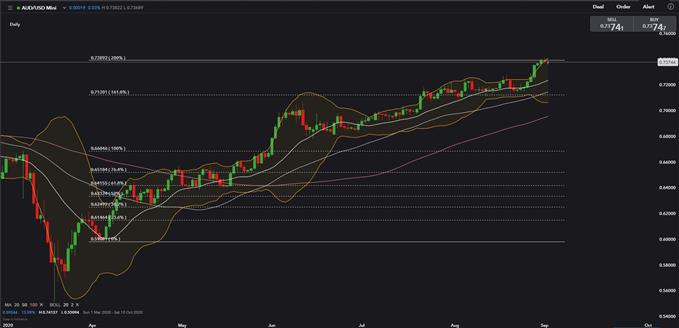
- AUD/USD faces a key resistance level at 0.7390 – the 200% Fibonacci extension
Dow Jones Industrial AverageOutlook:
US stocks surged on Tuesday on encouraging macroeconomic data. The ISM Manufacturing PMI surged to 56.0 – its highest level seen since November 2018. The reading also beat the market forecast of 54.5, suggesting a faster-than-expected pace of recovery in North America’s manufacturing sector. Another gauge – Markit Manufacturing PMI – came in slightly below market expectation at 53.1. Despite this, both readings mark the fourth consecutive month of recovery and have moved firmly into expansionary territory since June 2020.
A PMI reading above 50 indicates that the manufacturing economy is generally expanding, whereas below 50 indicates that it is generally declining.
Asia-Pacific stocks may follow the strong US lead and move higher on Wednesday, as suggested by futures markets. This is despite the volatility of US shares – the closely-watched VIX index – continuing to nudge higher to 30.96. This unusual phenomenon, however, may suggest that the tech-led stock market rally is vulnerable to a technical pullback.
US ISM Manufacturing PMI – Aug 2020
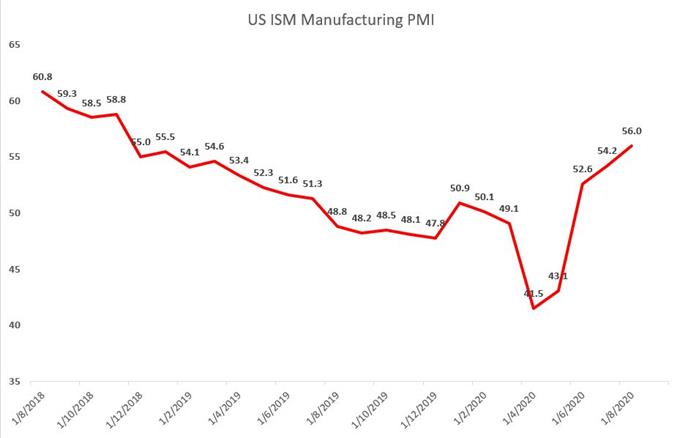
Source: Bloomberg, DailyFX
Sector-wise, materials (+4.77%), consumer staples (+1.9%) and information technology (+1.57%) were leading, while energy (-1.01%) and healthcare (-0.61%) were lagging.
Dow Jones Index Sector performance 1-9-2020

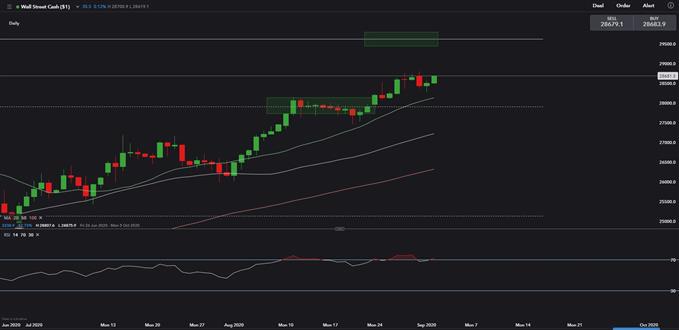
Technically,the Dow is riding a bullish trend but may face some technical pullback as the RSI indicator has flipped back from the overbought zone above 70.0. Immediate support and resistance levels can be found at 27,900 and 29,600 respectively.
Dow Jones Index – Daily Chart
ASX 200 Index Outlook:
Australia’s ASX 200 stock benchmark plunged 1.7% on Tuesday after Facebook threatened to block news on Australian sites if proposed royalty regulations became law. Today’s release of the 2Q GDP figure will be carefully watched by ASX and Australian Dollar traders. The forecast is a -5.3% YoY plunge in economic growth – a record-setting decline. An outcome that beats expectation may help to boost confidence and alleviate selling pressure.
Australia GDP SA YoY
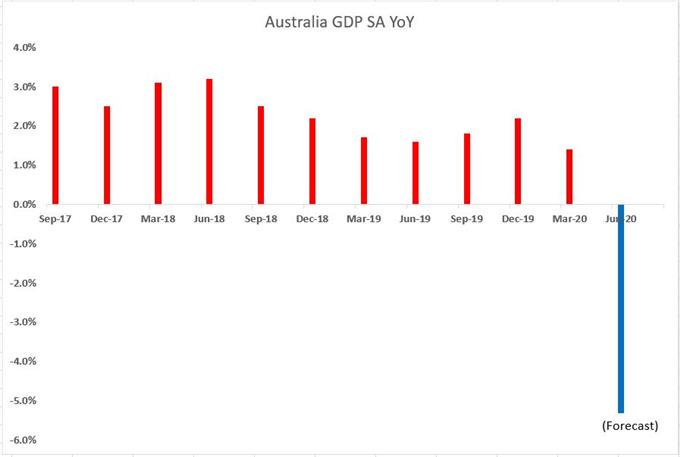
Source: Bloomberg, DailyFX
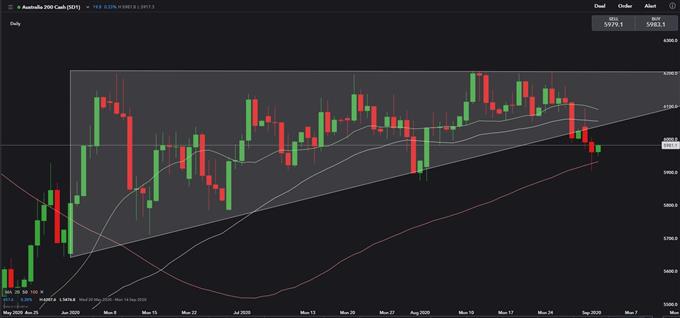
Technically, the ASX 200 has likely broken below a “Descending Triangle” that formed some months ago. Near-term momentum has turned bearish as suggested by the 20- and 50-Day Simple Moving Average (SMA) lines.
ASX 200 Index – Daily Chart
AUD/USD is facing a key resistance level at 0.739 – the 200% Fibonacci extension. Failing to break through this level will probably lead to a technical pullback towards immediate support at 0.723.
AUD/USD – Daily Chart

--- Written by Margaret Yang, Strategist for DailyFX.com
To contact Margaret, use the Comments section below or @margaretyjy on Twitter


