


New Zealand Dollar, NZD/USD, NZD/JPY, AUD/NZD, Technical Outlook – Talking Points:
- AUD/NZD Bull Flag formation may hint at further buying pressure in the coming days.
- NZD/JPY perched precariously atop sentiment-defining moving average support.
- NZD/USD Ascending Channel attempting to guide price higher.
The New Zealand Dollar may continue to come under pressure in the near term against its major counterparts, as AUD/NZD rates consolidate in a bullish chart formation while NZD/JPY and NZD/USD eye fresh monthly lows.
AUD/NZD Daily Chart – Bull Flag in Play
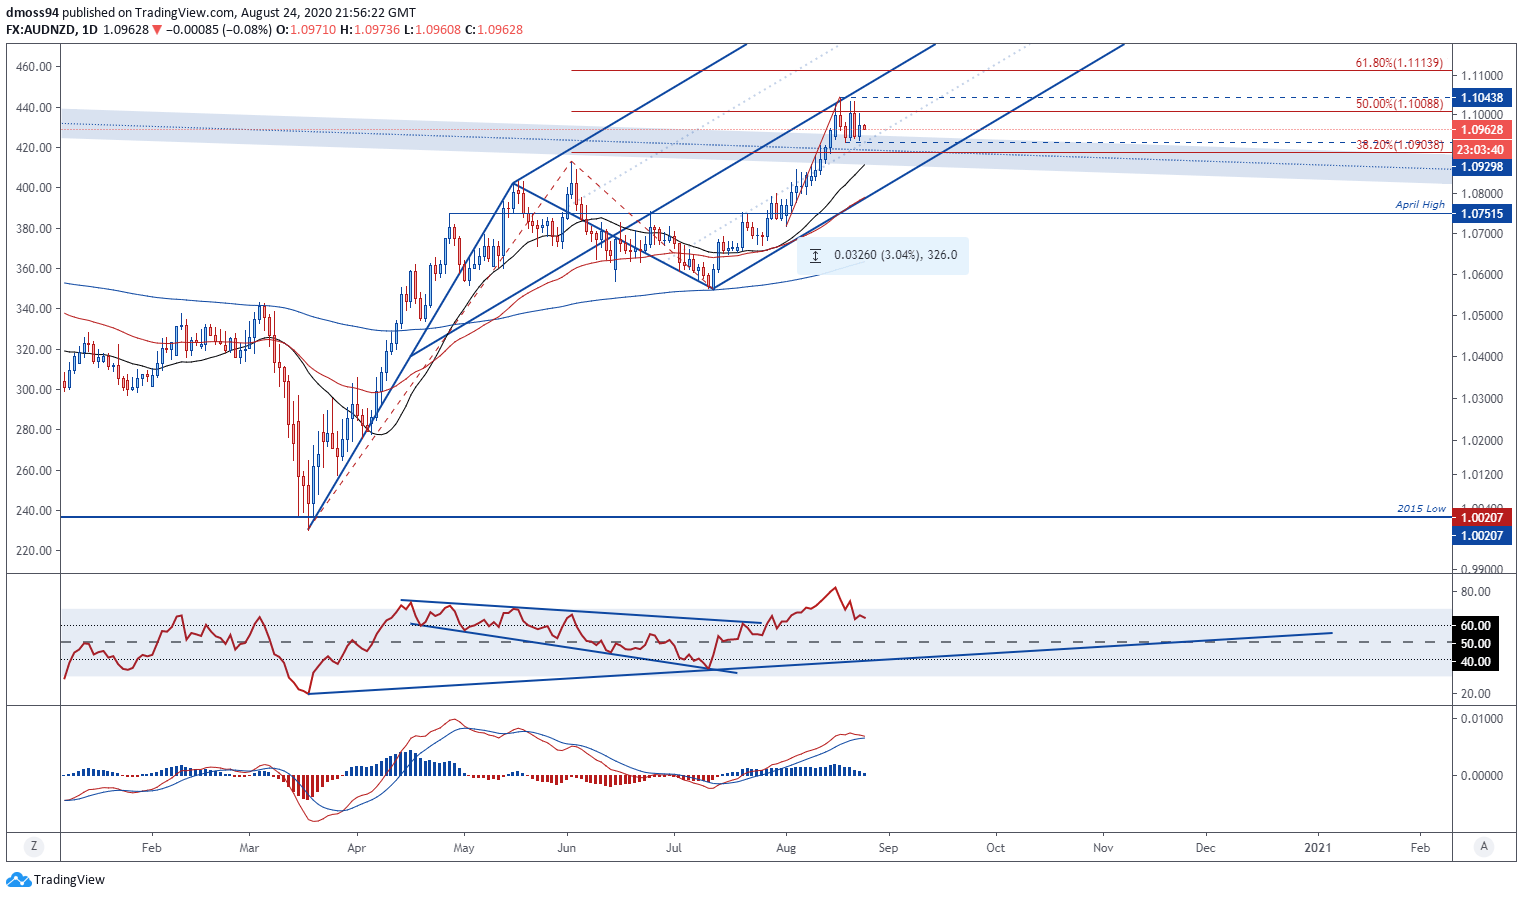
AUD/NZD daily chart created using TradingView
AUD/NZD rates kicked off August with a run of 11 consecutive up-days, as price rose just over 3% to breach key downtrend resistance extending from the 2015 high (1.1429) and push to a fresh 2-year high (1.1043).
The 50% Fibonacci expansion (1.1008) appears to have stifled buying pressure for the time being, with psychological resistance at the 1.10 level proving to be a significant challenge for AUD bulls.
That being said, AUD/NZD may be gearing up to extend its climb higher as it carves out a Bull Flag continuation pattern above the August 18 swing-low (1.0930).
Furthermore, the RSI is perched constructively above 60 and the slope of the 21-, 50- and 200-day moving averages have notably steepened. This is indicative of swelling bullish momentum and may lead to an extension of the AUD/NZD exchange rate’s 5-month climb.
A daily close above the monthly high (1.1043) is needed to validate the bullish pattern and could trigger the resumption of the primary uptrend, with the implied measured move indicating a surge to test the 1.12 level could be in the offing.
NZD/JPY Daily Chart – Break of July Low Ominous for NZD Bulls
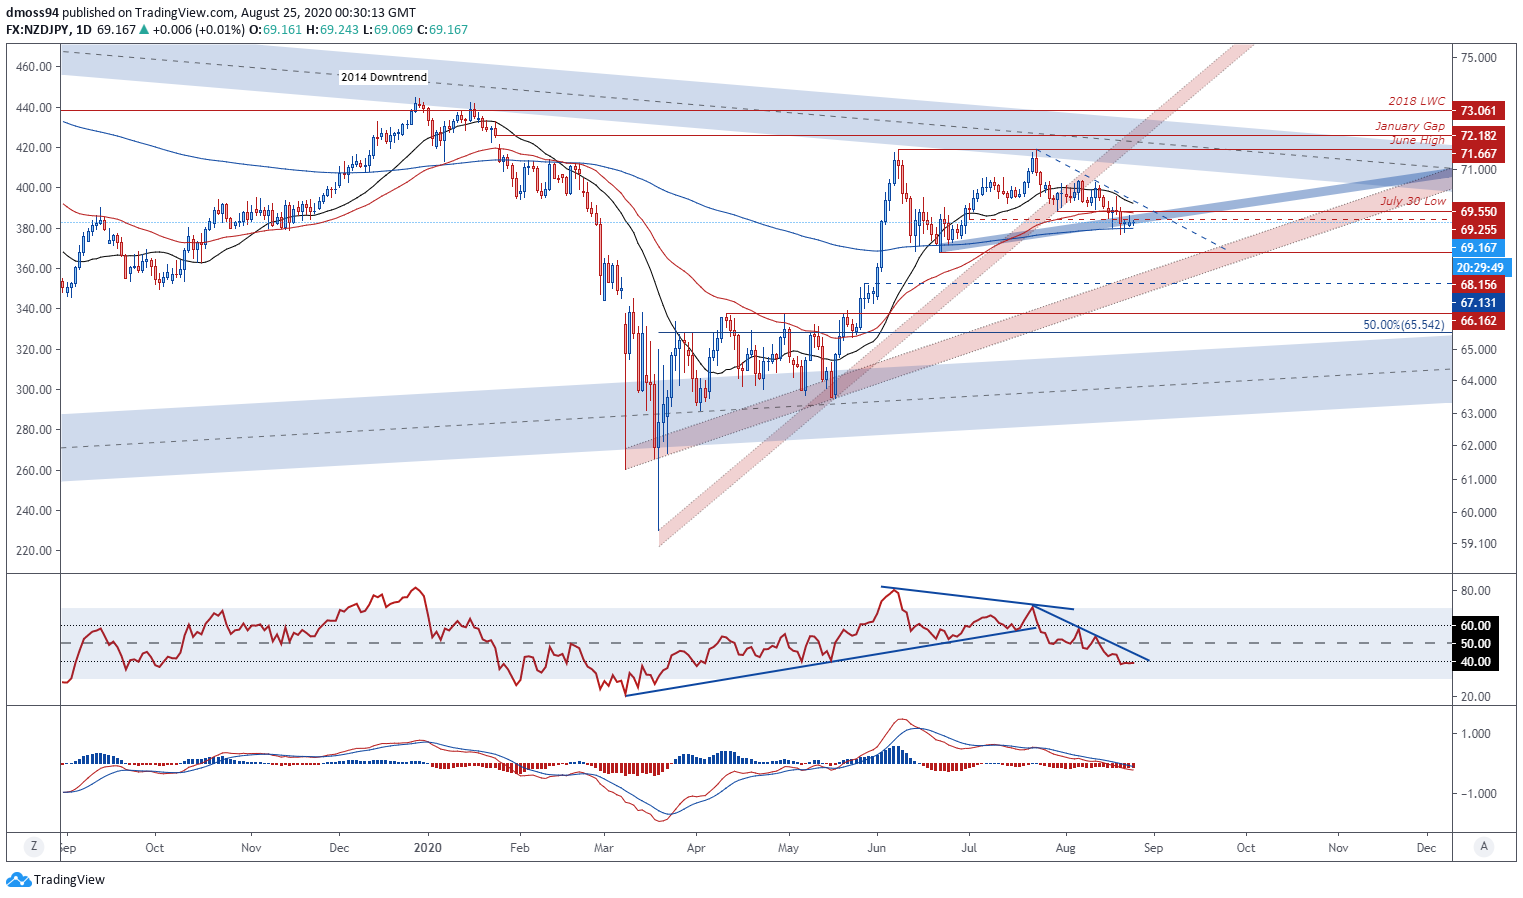
NZD/JPY daily chart created using TradingView
The 200-day moving average appears to have temporarily halted NZD/JPY’s 4-week decline from the July high (71.67), after price easily sliced through the July 30 swing-low (69.55) and trend-defining 50-DMA (69.60).
Further losses could be in the offing however, as price struggles to climb back above the July low (69.25) and the RSI dips below 40 into bearish territory.
The MACD indicator’s first venture below 0 since late May compounds the bearish signals reflected in recent price action and may intensify selling pressure in the coming days.
To that end, NZD/JPY rates seem poised to slide back to support at the June 22 swing-low (68.15), with a break below the psychologically imposing 68 level probably guiding price back to confluent support at the May high (67.13) and March uptrend.
Conversely, a daily close above the July 30 swing-low (69.55) and downtrend extending from last month’s high may encourage would-be buyers, possibly carving out a path for price to re-test the June high and perhaps fill in the January breakaway gap (72.18).
NZD/USD Daily Chart – Parallel Channels Guiding Price
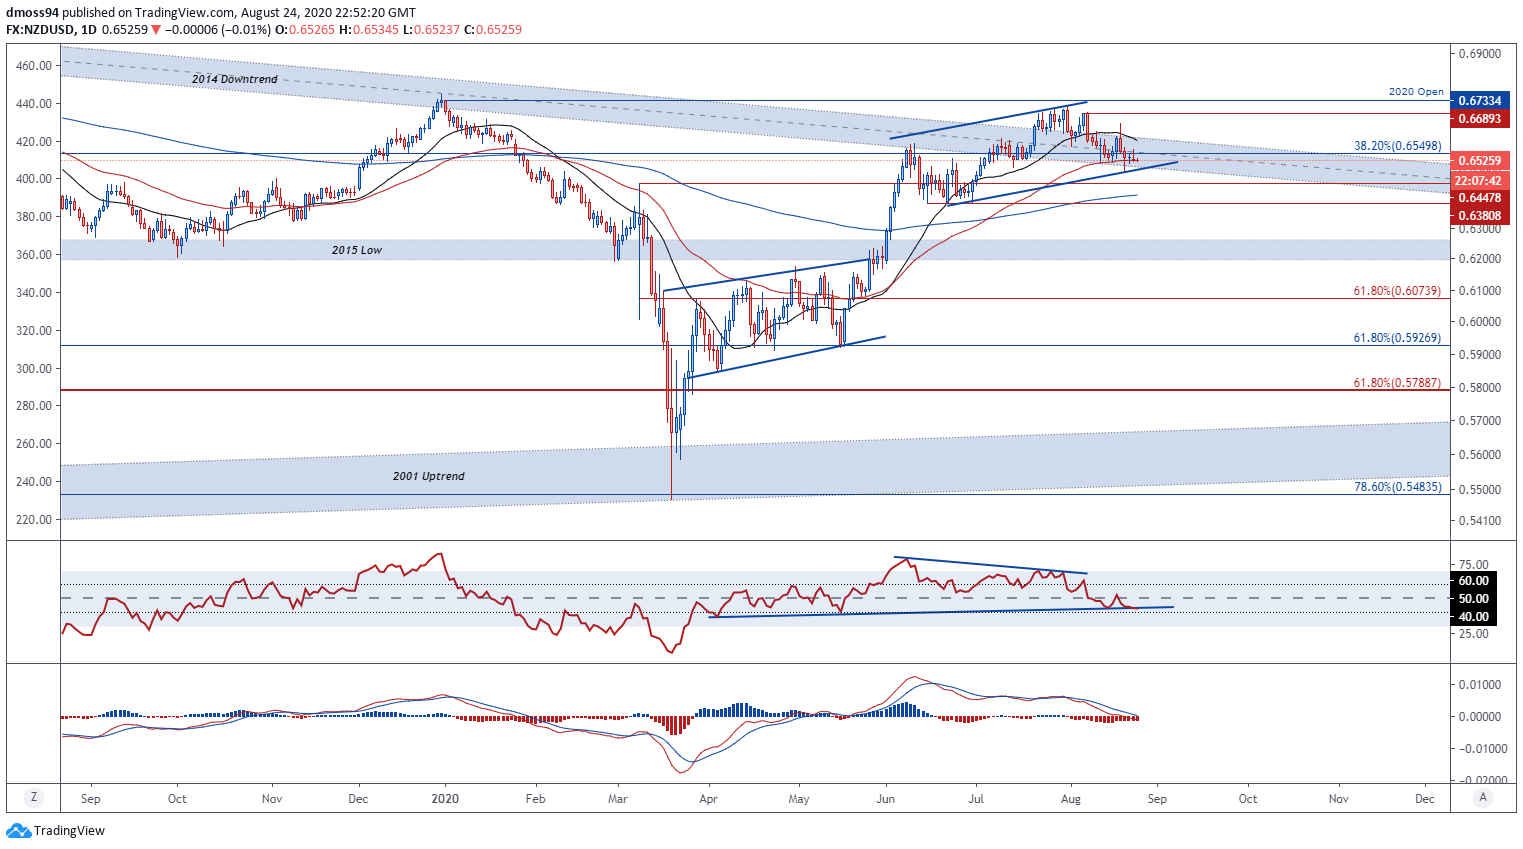
NZD/USD daily chart created using TradingView
Since setting the post-crisis high on July 31 (0.6715) the NZD/USD exchange rate has drifted steadily lower, sliding as much as 3% to break back below the 0.65 level for the first time in 6 weeks.
Nevertheless, the outlook for the risk-associated currency remains skewed to the upside, if Ascending Channel support and the monthly low (0.6488) remain intact.
Moreover, the RSI seems to be swerving away from bearish territory below 40, whilst the ‘faster’ MACD line gears up to cross above its ‘slower’ Signal line counterpart. This suggests a resumption of the uptrend extending from March could be in the offing.
With that in mind, NZD/USD rates could push back towards the August high (0.6689) if buyers successfully overcome the 38.2% Fibonacci (0.6549) and 21-DMA (0.6592).
On the other hand, a break below the monthly low (0.6488) would probably result in a slide back to the sentiment-defining 200-DMA (0.6408) and invalidate bullish potential.
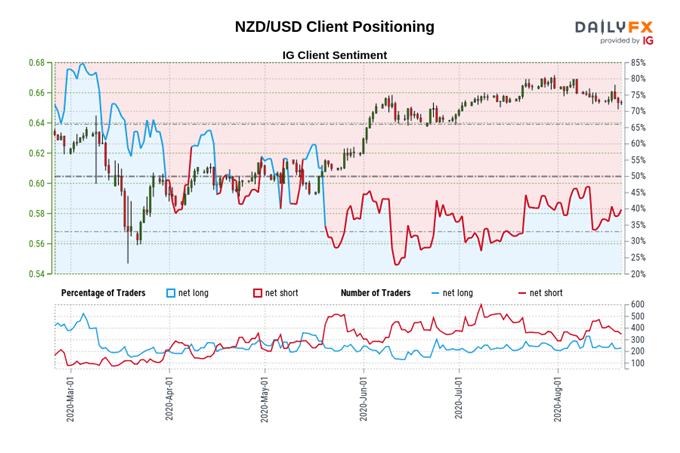
Source – IG Client Sentiment Report
NZD/USD: Retail trader data shows 34.02% of traders are net-long with the ratio of traders short to long at 1.94 to 1. The number of traders net-long is 13.54% lower than yesterday and 17.84% lower from last week, while the number of traders net-short is 8.17% higher than yesterday and 7.47% lower from last week.
We typically take a contrarian view to crowd sentiment, and the fact traders are net-short suggests NZD/USD prices may continue to rise.
Traders are further net-short than yesterday and last week, and the combination of current sentiment and recent changes gives us a stronger NZD/USD-bullish contrarian trading bias.
| Change in | Longs | Shorts | OI |
| Daily | 6% | -13% | 2% |
| Weekly | 40% | -35% | 15% |
-- Written by Daniel Moss, Analyst for DailyFX
Follow me on Twitter @DanielGMoss


