


S&P 500, US DOLLAR, HANG SENG INDEX OUTLOOK:
- S&P 500 index hit a record high, but only 33.5% of the companies were in the green
- The US Dollar Index (DXY) broke below support at 92.6, hitting a fresh 2-year low
- Hang Seng Index may open lower, failing to catch up with the rally in US markets
S&P 500 Index Outlook:
The S&P 500 index rallied to an all-time high alongside the Nasdaq Composite, against the backdrop of thin volume. It is worth noting that 66.5% of the index’s components ended lower – a weird phenomenon that was last observed back during the 2000-2001 ‘Dot Com’ bubble.
Uncertainties surrounding the approval of a second US fiscal stimulus package remain, while a review of the phase-one US-China trade deal is in limbo. These are two potential catalysts for equity market volatility.
Sector-wise, consumer discretionary (+1.46%), communication services (+1.09%) and information technology (+0.39%) were leading gains, whereas energy (-1.71%), financials (-0.67%) and industrials (-0.54%) were lagging. The sectoral performance shows a very mixed, if not bearish-biased pattern.
S&P 500 Index Sector performance 18-8-2020
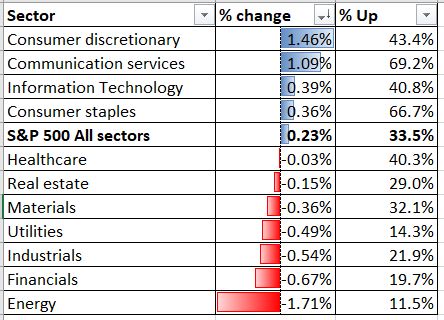
Source: Bloomberg, DailyFX
Technically, the index is riding an ascending trend (chart below), with its 20-, 50- and 100-Day Simple Moving Average (SMA) lines trending up. The S&P 500 has likely broken above a 200% Fibonacci extension level at 3,360 this week, and thus may have room for further upside. A potential technical pullback may lead to a retracement towards 3,360 and then 3,180.
S&P 500 – Daily Chart

US Dollar Index Outlook:
The US Dollar index fell 0.5% to its lowest level seen since May 2018. This renders tonight’s FOMC minutes and Thursday’s US weekly jobless claim report crucial in painting a clearer inflation and monetary policy outlook. Stronger-than-expected job market sentiment may boost the US Dollar.
There is a string of key inflation data due to be released from the UK, the Eurozone and Canada today, which is worth paying attention too.
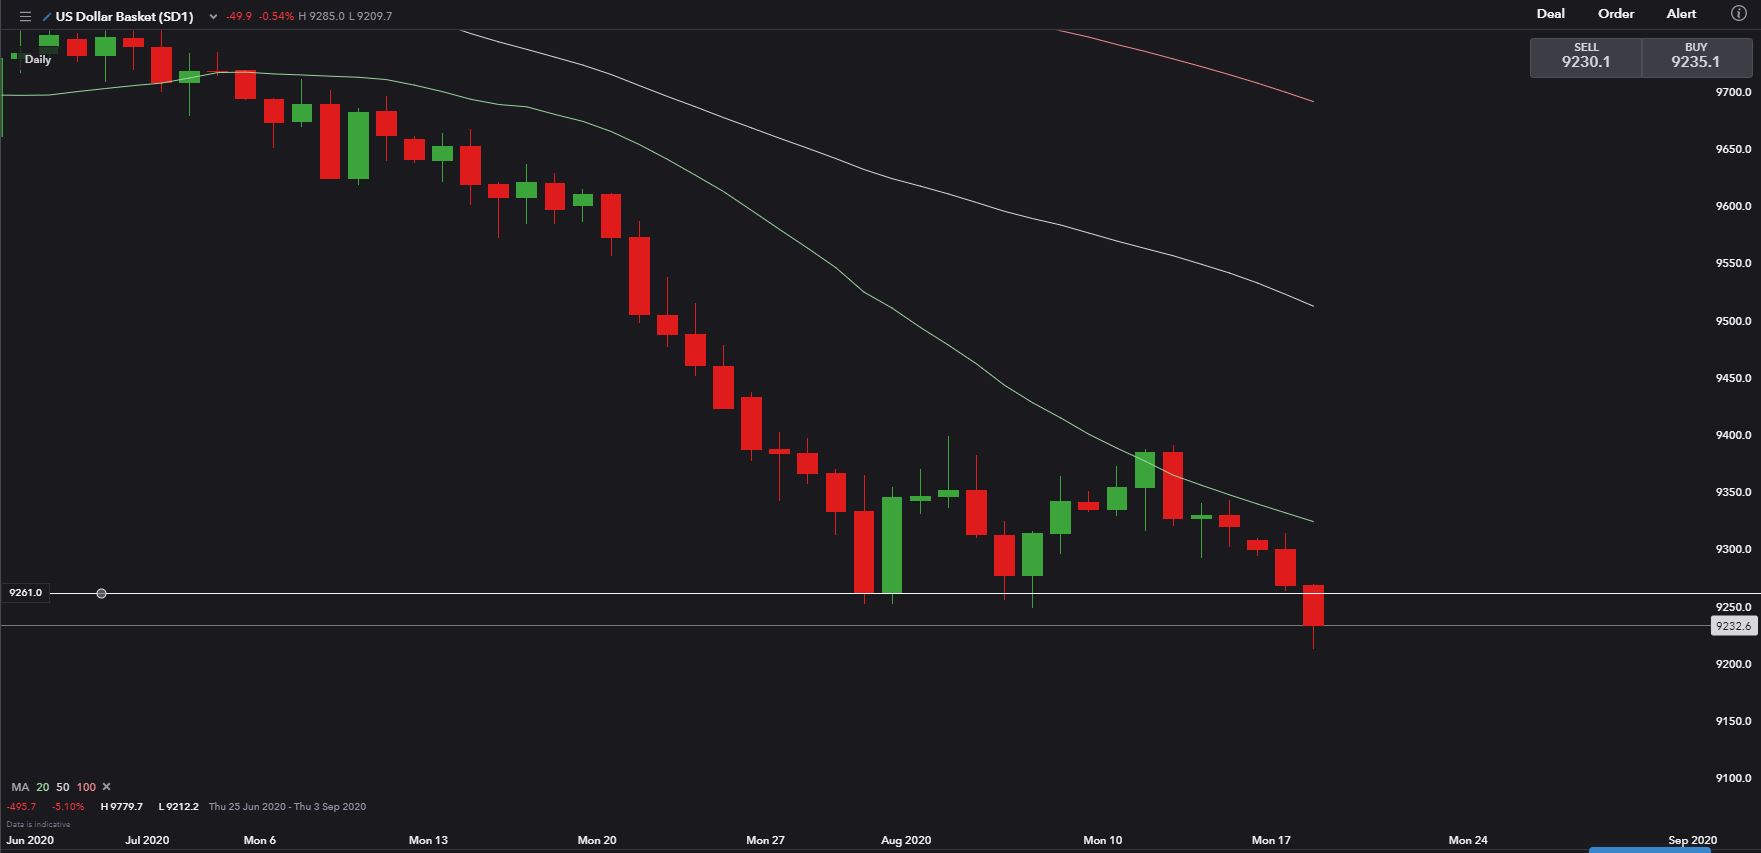
Technically, the US Dollar index has likely broken below a key support at 92.60, and thus opened the door for more downside towards 91.80. The overall trend remains bearish-biased.
US Dollar Index – Daily Chart
Hang Seng Index Outlook:
Hong Kong’s Hang Seng Index (HSI) stock benchmark is facing some selling pressure at around 25,500 as uncertainties surrounding the review of the phase-one US-China trade deal inhibit risk appetite. Tencent (+1.49%), China Mobile (+2.13%) and Mengniu Diary (+2.26%) were doing the heavy-lifting yesterday, while Sunny Optical (-9.45%), HSBC (-1.01%) and AIA (-0.47%) were dragging.
Futures markets point to a lower opening of Hang Seng on Wednesday.
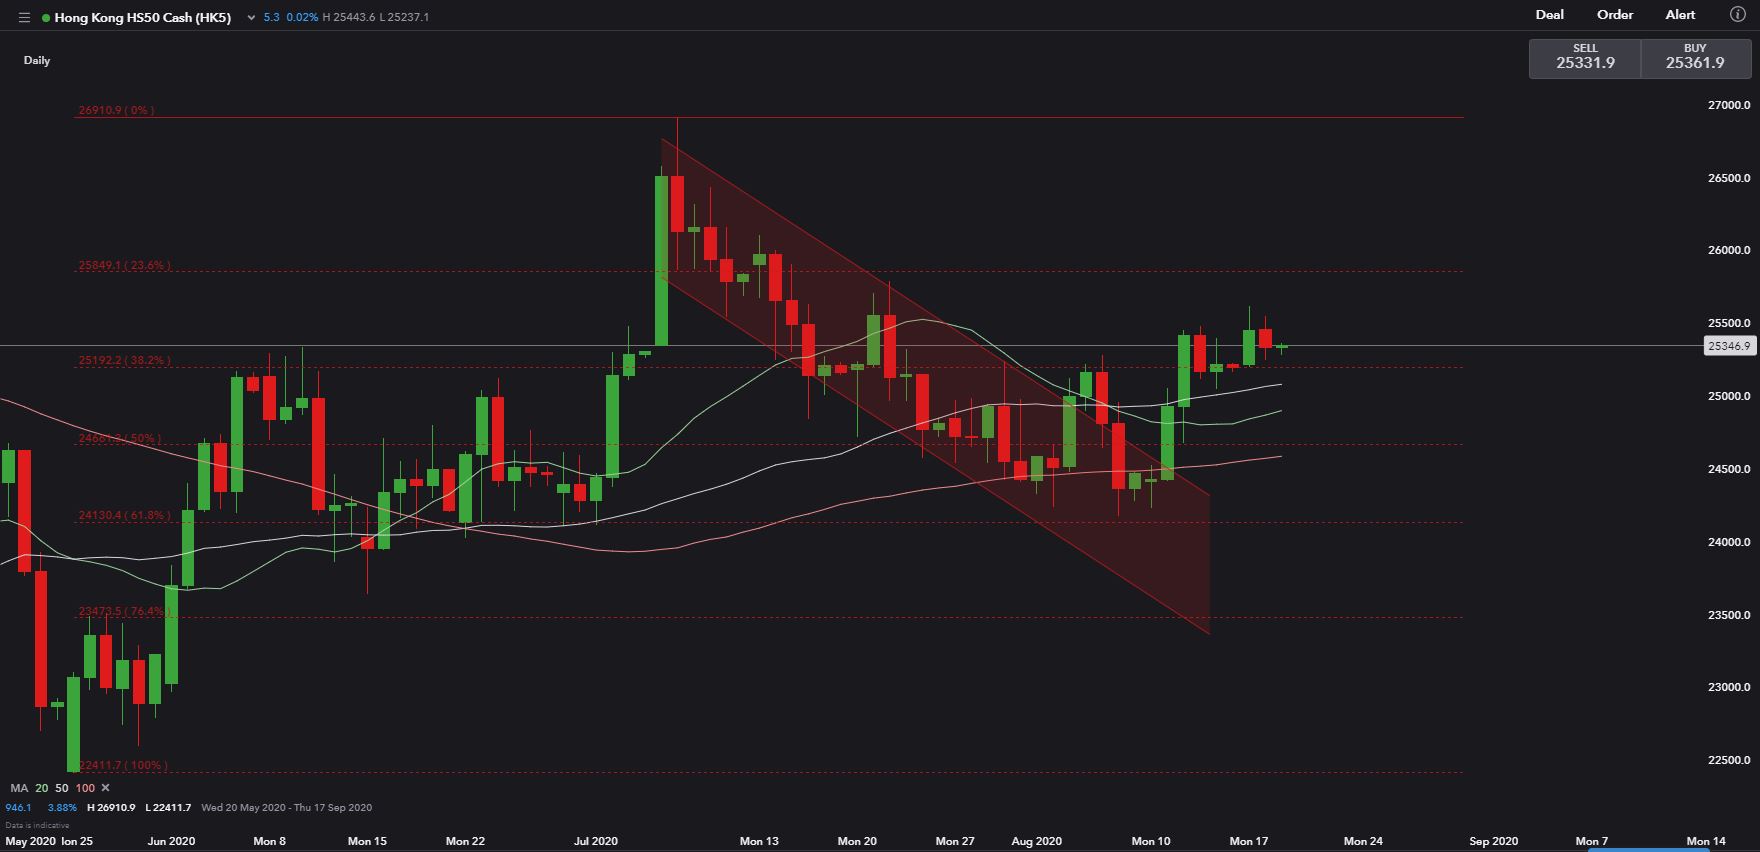
Technically, HSI has broken out of a descending channel last week and attempted a bullish reversal. Its immediate support and resistance levels can be found at 25,200 (38.2% Fibonacci retracement) and 25,860 (23.6% Fib) respectively.
Hang Seng Index – Daily Chart

--- Written by Margaret Yang, Strategist for DailyFX.com
To contact Margaret, use the Comments section below or @margaretyjy on Twitter


