


GBP/USD Price, Chart and Analysis:
The latest set of ONS inflation data showed prices picking up in July in the UK, with rising fuel costs, clothing and furniture and household goods making the largest upward contribution. The Consumer Price Index including owner-occupier household costs (CPIH) rose on a y/y basis to 1.1% in July from 0.8% in June, as lockdown restrictions eased. Headline UK inflation, CPI, rose to 1% in July from 0.6% in June.
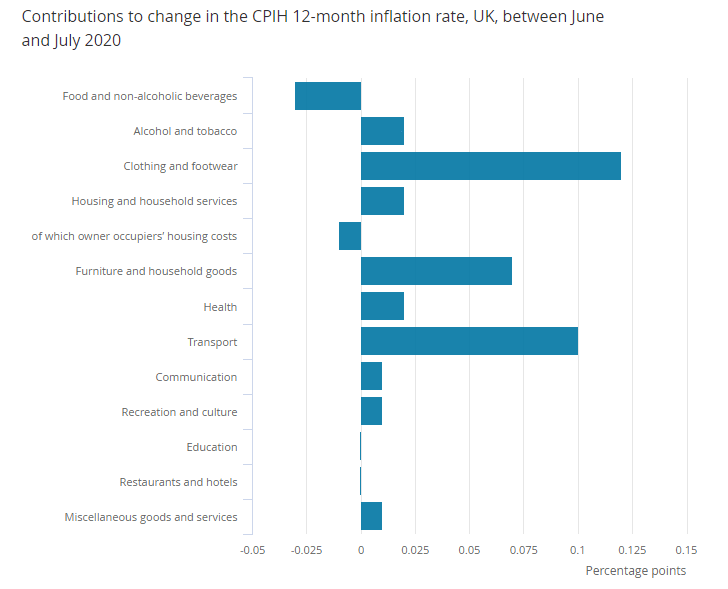
Data via the ONS
For all economic data releases and market moving events, see the DailyFX Economic Calendar

GBP/USD continues to benefit from a weak US dollar and this morning made a new yearly high at 1.3267 before the pair drifted lower. Tuesday’s rally saw the pair break above trend resistance from a basic pennant formation that I have noted over the last few days, and while this remains the case, the 1.3515 print made in early December 2019 remains the longer-term target.
Pennant Patterns – Trading Bullish and Bearish Pennants
Initial support now moves up to the 1.3120-1.3140 zone, before the supportive 20-dma and trend support cut across around 1.3070. While the chart remains positive, apart from the CCI which shows the pair are overbought, the FOMC minutes released later today and Friday’s UK and US PMIs could well dampen the positive sentiment prevailing in GBP/USD. There is also likely to be an update on how the EU/UK trade talks are progressing by the end of the week, an announcement that could well see volatility jump in GBP-pairs.
GBP/USD Daily Price Chart (December 2019 – August 19, 2020)

| Change in | Longs | Shorts | OI |
| Daily | 0% | -6% | -2% |
| Weekly | -14% | 25% | -1% |
Traders of all levels and abilities will find something to help them make more informed decisions in the new and improved DailyFX Trading Education Centre
What is your view on Sterling – bullish or bearish?? You can let us know via the form at the end of this piece or you can contact the author via Twitter @nickcawley1.


