


Nasdaq 100 Price Outlook:
- The Nasdaq 100 tip-toed further into uncharted territory on Monday as gains slow to a crawl
- Price action may remain controlled as traders await FOMC minutes later this week
- Dow Jones, S&P 500 & FTSE 100 Forecasts for the Week Ahead
Nasdaq 100 Forecast: Index Crawls Higher as Gains Slow at Record Levels
The Nasdaq 100 crept higher in Monday trading as the Dow Jones and S&P 500 followed suit. More broadly, the three US indices have enjoyed noteworthy gains in the last few weeks but progress has since slowed as seasonality and looming event risk look to suppress trading activity. Together, the seasonal ankle weights have likely helped stall price gains for the Nasdaq 100, Dow Jones and S&P 500.
Summer Doldrums Weigh on Price Gains
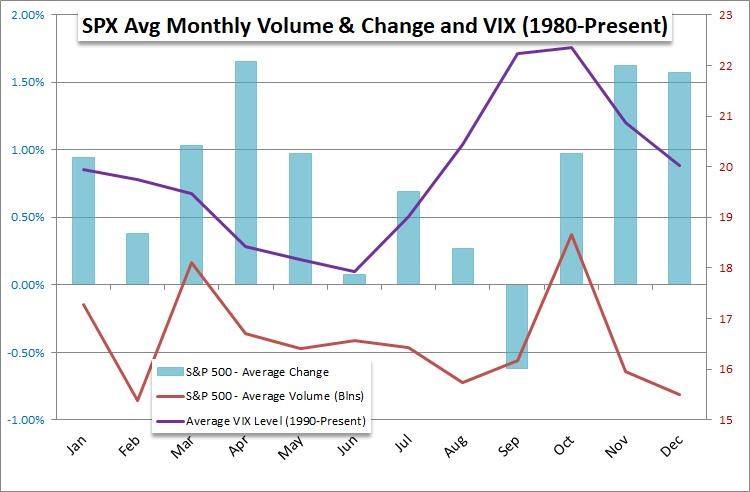
Source: Bloomberg, John Kicklighter
To be sure, August and the other summer months are some of the most calm each year. While the covid outbreak may have influenced higher volatility in the beginning of the summer season, recent price action might suggest longer-term trends have reemerged and August has seen timid moves – with the exception of last Tuesday – as a result. Further still, the looming FOMC minutes release could crimp trading activity this week in particular.

Evidently, there are themes present that could be responsible for the recent slow in gains. That said, there is little reason to suggest the fundamental forces that were present when prior gains were established have suddenly left the market. Coupled with record price levels for the Nasdaq 100 and near record levels for the S&P 500, the technical picture is similarly encouraging as few things are more reflective of a bull market than fresh all-time highs.
Nasdaq 100 Price Chart: 4 – Hour Time Frame (April 2020 – August 2020)
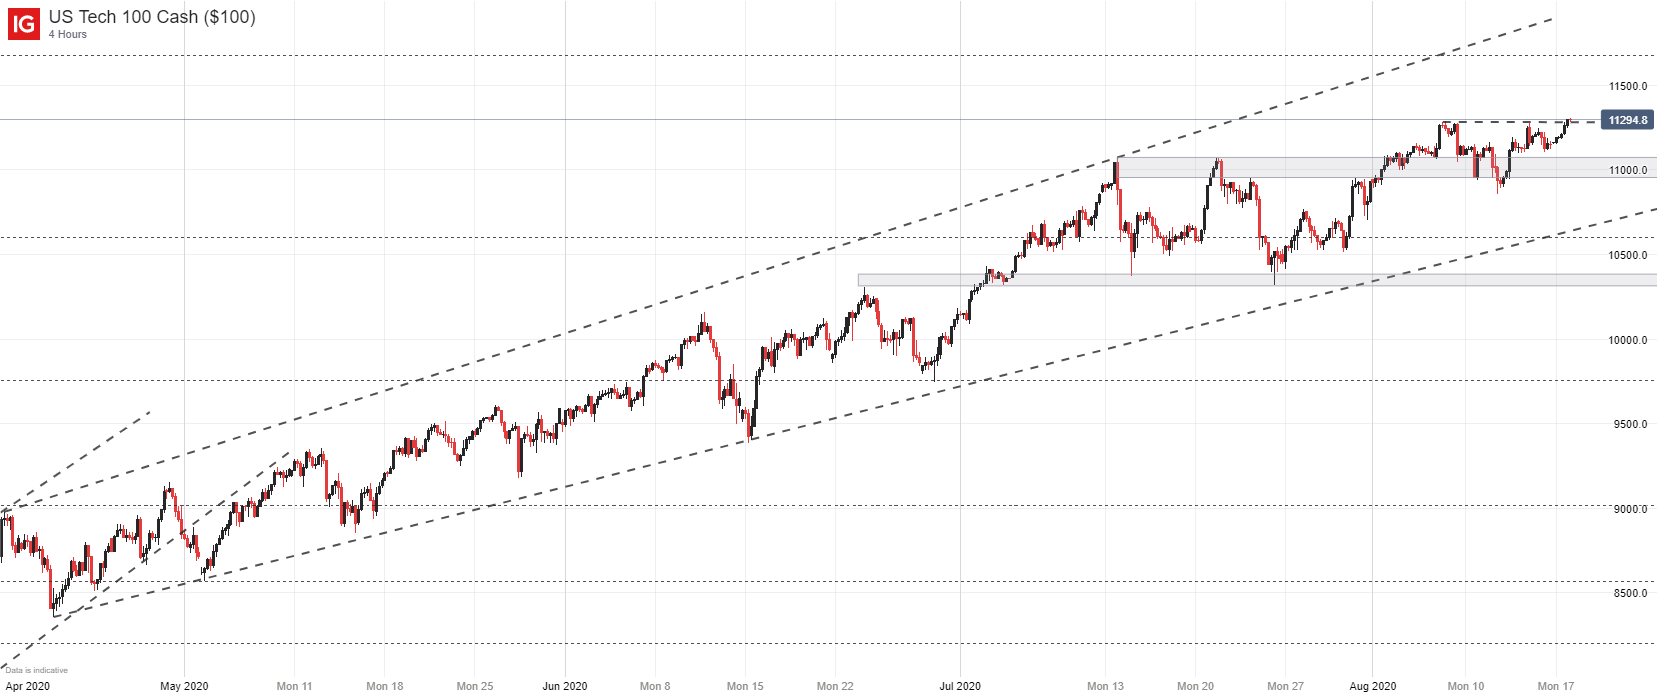
Thus, I am hesitant to suggestion the Nasdaq 100 will suddenly reverse course lower. If selling pressures emerge, a multitude of technical support exists that could look to stall losses. To that end, the effective line in the sand at this point in time may be around the 10,310 mark for the Nasdaq. Should losses pierce the supportive band and establish a new swing low, it might fundamentally change the technical landscape. In the meantime, shorter-term declines may serve as consolidation until the driving forces behind the rally change or election uncertainty grows.
--Written by Peter Hanks, Strategist for DailyFX.com
Contact and follow Peter on Twitter @PeterHanksFX


