


Dow Jones, S&P 500, FTSE 100 Price Outlooks:
- The Dow Jones poked above resistance to establish a fresh high that might allow for further gains
- The S&P 500 stands narrowly beneath all-time highs, a key psychological landmark
- Elsewhere, the FTSE 100 saw a tumultuous trading week as resistance worked to stall a break out
Dow Jones Technical Forecast
Outlook: Bullish
The Dow Jones stepped timidly above its June high last week to establish a new post-covid peak around the 28,000 level, an encouraging development for those in pursuit of a bullish continuation. That said, price action undoubtedly slowed after price surpassed the June peak, evidenced by tiny candlesticks to finish the week. While the lack of enthusiasm might warrant concern in the shorter-term, the establishment of a new high is a positive technical development for the medium term in my opinion.
Dow Jones Price Chart: Daily Time Frame (January 2020 – August 2020)
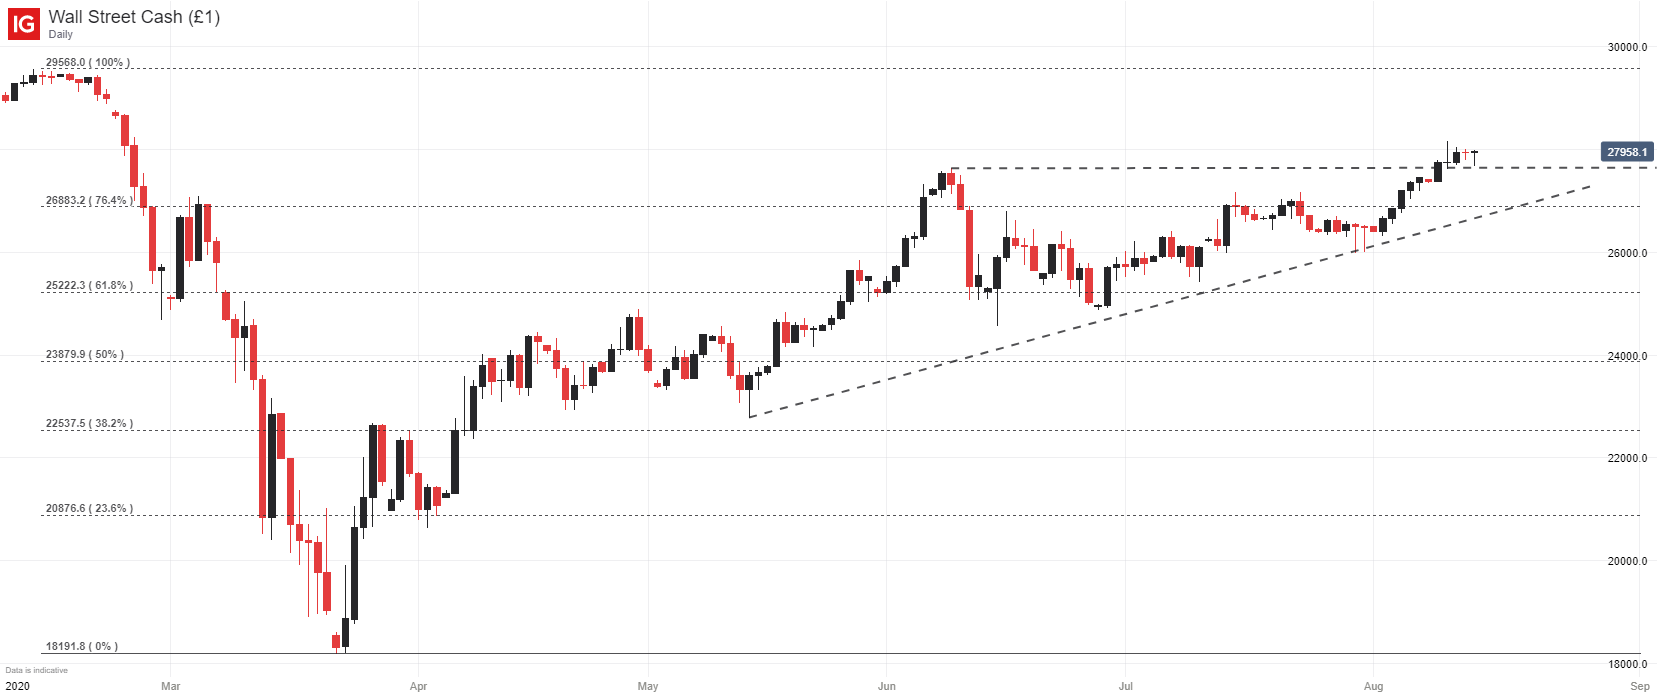
To that end, pullbacks from the current altitude could look for support at the June peak, the Fibonacci level at 26,883 and, perhaps most importantly, the rising trendline from mid-May. The line is derived from a series of higher-lows that have helped create a bullish technical backdrop.
Therefore, declines in the near future may serve as healthy consolidation unless a break beneath the trendline and the late-July swing-low occurs, which would then warrant a reassessment of the technical outlook. All in all, the technical backdrop is encouraging for a continuation higher, but prudent strategy may suggest patience until a more advantageous entry point presents itself.
S&P 500 Technical Forecast
Outlook: Neutral
The S&P 500 finds itself in similar standing. Creeping just beneath the index’s all-time high around 2,397, price has almost fully recovered from the covid crash and a confident breach above prior peaks might open the door for a continuation higher. That said, the breach has been anything but confident as price meandered through the same price range for much of last week.
S&P 500 Price Chart: 4 – Hour Time Frame (February 2020 – August 2020)
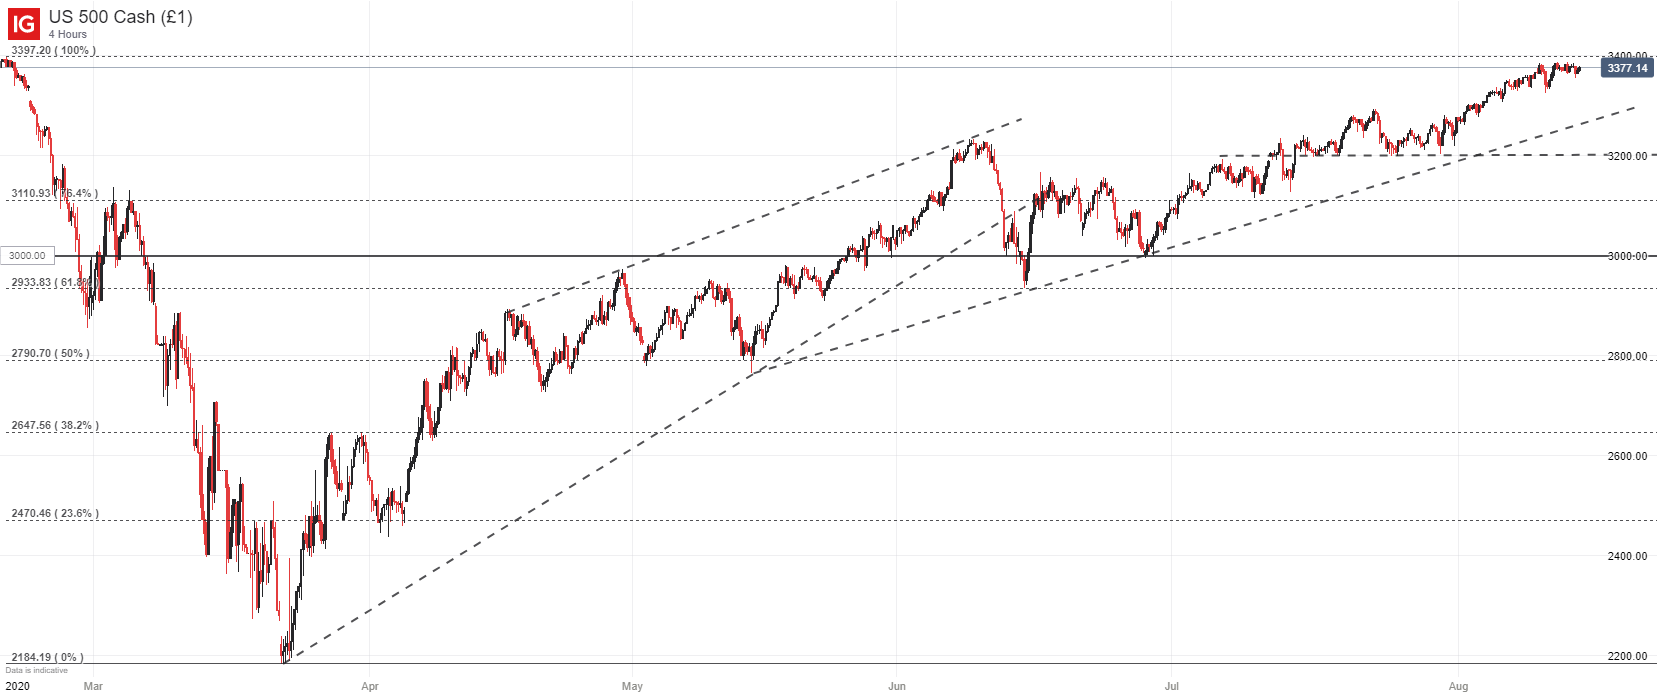
Consequently, the S&P 500 appears vulnerable with its current standing – just like the Dow Jones – as both are knocking on the door of new levels, but neither is doing so with a lot of confidence or enthusiasm – which does not bode well for a potential follow-through.
With that in mind, I would again suggest patience if looking to trade the US indices as the current risk-reward profile is not particularly enticing in my view. Should a modest pullback occur, it would allow for more attractive entry points while offering much-needed consolidation after weeks of nearly unabated gains, given that the pullback did not materially change the technical picture.
FTSE 100 Technical Forecast
Outlook: Neutral
If in pursuit of material technical changes, the FTSE 100 is assuredly not the index to consult. However, it may present a prime opportunity for range traders as the technical formation that has been present since mid-June displayed its influence once again last week.
FTSE 100 Price Chart: 4 – Hour Time Frame (May 2020 – August 2020)

After a better than expected UK GDP reading helped spark a rally last week, it appeared as though the FTSE 100 may have finally found the spark necessary to break out of the confines of its horizontal trading range. Evidently, resistance around the 6,300 level was unwilling to yield to bullish intentions, leading to a quick reversal lower for the FTSE 100 which seems to have found some support near the Fibonacci level at 6,065.
Top 8 Forex Trading Strategies and their Pros and Cons
While the initial move looked promising, the abrupt turn lower helps highlight the strength of the current technical formation which could provide an attractive opportunity for range traders. Either way, it seems as though the FTSE 100 is unwilling to break higher at this time, so the forecast for the coming weeks remains neutral until the technical pattern can be broken. In the meantime, follow @PeterHanksFX on Twitter for updates and analysis.
--Written by Peter Hanks, Strategist for DailyFX.com


