


UK Q2 GDP and GBP/USD Price, Chart and Analysis:
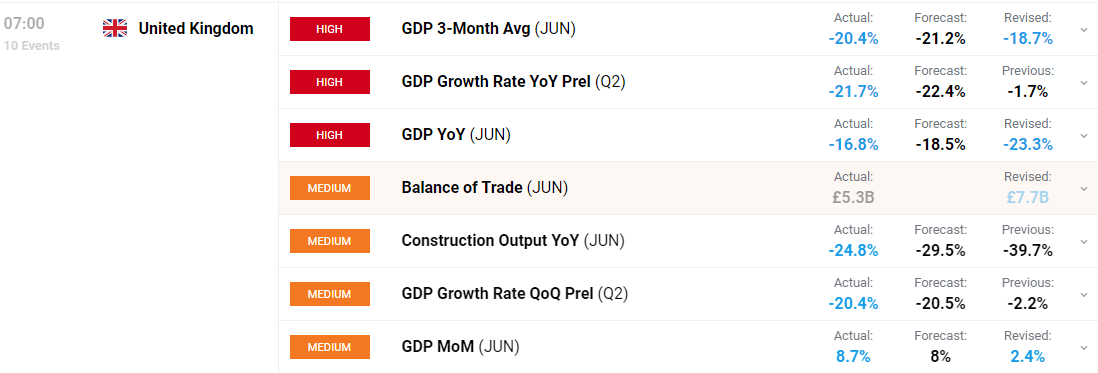
- UK Q2 GDP fell by a record 20.4%, the largest contraction on record.
- Sterling unchanged on the release as June data points to a pick-up in activity.

The latest UK GDP data showed that the economy entered into a technical recession as activity slumped across the board. The preliminary Q2 q/q reading fell by a record 20.4%, the largest fall since quarterly records began in 1955. Today’s ONS data shows that the UK economy is now 22.1% smaller than it was at the end of 2019, highlighting the effect the COVID-19 pandemic has had on economic activity.
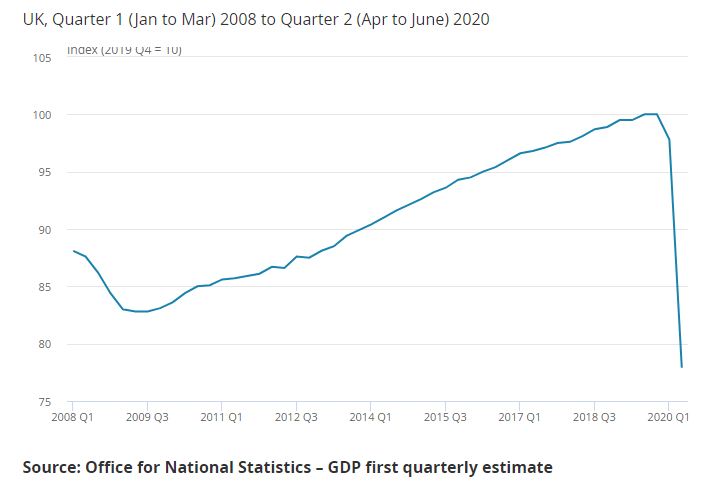
There was a small ray of light in today’s release with the June monthly reading showing growth of 8.7%, beating estimates of 8.0% as the UK began to unwind lockdown measures.
For all market-moving data releases and events see the DailyFX Economic Calendar
GBP/USD remains little changed post-GDP release and trades just under 1.3050, a level the pair opened up at this week. Short-term support remains around the 1.3000 big figure with 1.2978 a secondary level consisting of the 20-dma and the August low print. The technical golden cross – 50-dma through the 200-dma – still underpins Sterling to a certain extent with Tuesday’s high of 1.3136 the first upside target.
How to Read a Candlestick Chart
GBP/USD Daily Price Chart (December 2019 – August 12, 2020)

| Change in | Longs | Shorts | OI |
| Daily | 3% | -7% | -3% |
| Weekly | 4% | -10% | -5% |
Traders of all levels and abilities will find something to help them make more informed decisions in the new and improved DailyFX Trading Education Centre
What is your view on Sterling – bullish or bearish?? You can let us know via the form at the end of this piece or you can contact the author via Twitter @nickcawley1.


