


New Zealand Dollar Price Outlook:
- New Zealand Dollar weakness has erupted after a dovish RBNZ rate decision
- NZD/USD slipped to a major trendline around 0.6507
- NZD/CAD exhibited a similar response, slumping to a supportive trendline from 2016
New Zealand Dollar Forecast: NZD/USD, NZD/CAD Slip to Major Support
The New Zealand Dollar has succumb to selling pressure this week as a dovish RBNZ looks to erode the Kiwi’s standing. As a result, NZD/USD has returned to a major trendline originating from early 2018. In the past, the trendline has influenced price on numerous occasions which may suggest it will offer support again in the future. With that in mind, should a bearish break beneath 0.6507 materialize, it could allow losses to accelerate.
NZD/USD Price Chart: Daily Time Frame (April 2018 - August 2020)

Conversely, a successful hold above the descending trendline would be an encouraging development for bulls looking to recoup recent losses. Should a recovery attempt occur, bulls may encounter possible resistance around the horizontal line at 0.6590 and near the 2020 peak at 0.6745.

NZD/CAD Forecast
Similar price action has taken place in NZD/CAD as Kiwi weakness drove the pair near a descending band dating back to 2016. The band has shown its influence on price on several occasions in recent years and conveniently coincides with a nearby Fibonacci level at present. Together, the two technical levels may provide an area of support for NZD/CAD around 0.8675.
NZD/CAD Price Chart: Daily Time Frame (November 2016 – August 2020)

If broken, NZD/CAD could accelerate lower and see losses mount as the pair looks to continue its multi-year downtrend. Nevertheless, it is hard to suggest prolonged bearishness as long as price remains above the trendline. Therefore, if bulls attempt a reversal they might encounter resistance near the 0.88 level. Beyond 0.88, resistance is rather sparse until the Fibonacci level at 0.8916.
NZD/CAD Price Chart: 4 - Hour Time Frame (May 2020 – August 2020)
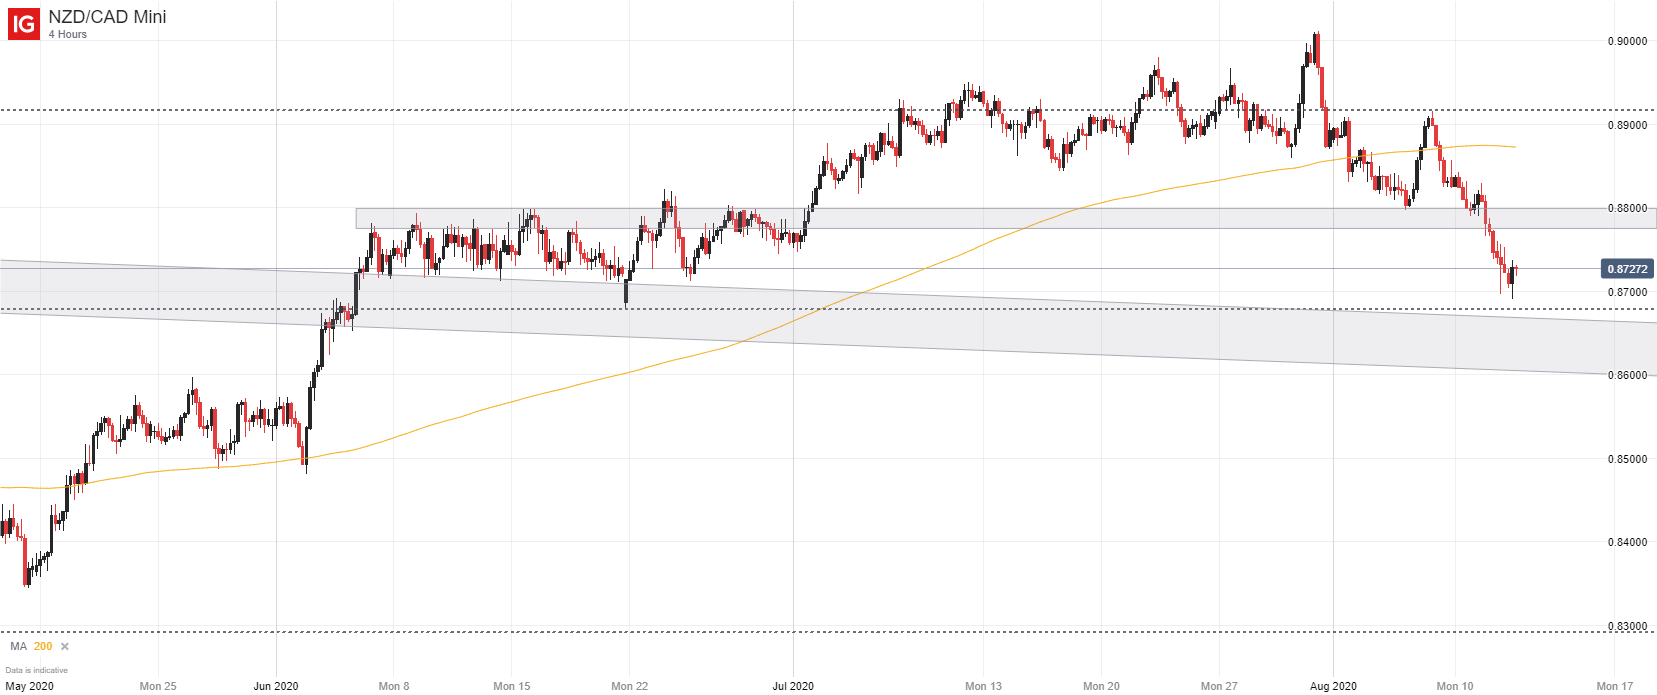
All in all, it seems the recent RBNZ decision has sparked a series of bearish moves but neither NZD/USD nor NZD/CAD have broken the significant levels of support beneath that would allow for further losses. To that end, traders should be wary of bearish breakdown as they may allow for break out trading opportunities. On the other hand, if support can successfully buoy price, losses may be limited to the immediate RBNZ aftermath. For further updates and analysis, follow @PeterHanksFX on Twitter.

--Written by Peter Hanks, Strategist for DailyFX.com
Contact and follow Peter on Twitter @PeterHanksFX


