


NASDAQ, NIKKEI 225 INDEX, GOLDPRICE OUTLOOK:
- Nasdaq fell 1.69% as investors switched out from technology shares into cyclical ones
- Japan’s Nikkei 225 index retraced to 22,700 after hitting a key resistance at 22,900
- Gold price registered its largest two-day fall since 2013, coming down to US$ 1,880
Nasdaq Index Outlook:
The Nasdaq index fell 1.69% on Tuesday. Sectoral rotation was observed in the US stock markets these days, in which investors took profits from the technology rally and switched into value and cyclical-sensitive ones. A seemingly over-stretched valuation in the tech sector eclipsed vaccine hopes and improving economic data, which points to a potential rotation towards. value and cyclical stocks.
Uncertainties surrounding the US fiscal stimulus package are also weighing on risk appetite across the broader markets. The Treasury yield curve has steepened lately, suggesting rising inflation prospects and perhaps a more hawkish-biased central bank outlook.
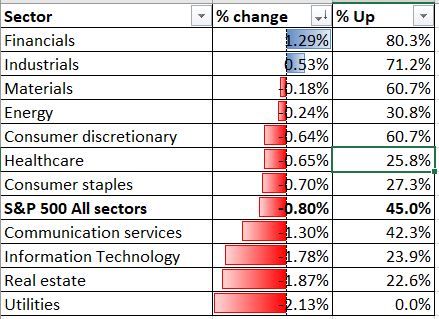
Among the S&P 500 sectors, financials (+1.29%) and industrials (+0.53%) were leading while utilities (-2.13%), real estate (-1.87%), and information technology (-1.78%) were lagging.
S&P 500 Sector performance 11-8-2020
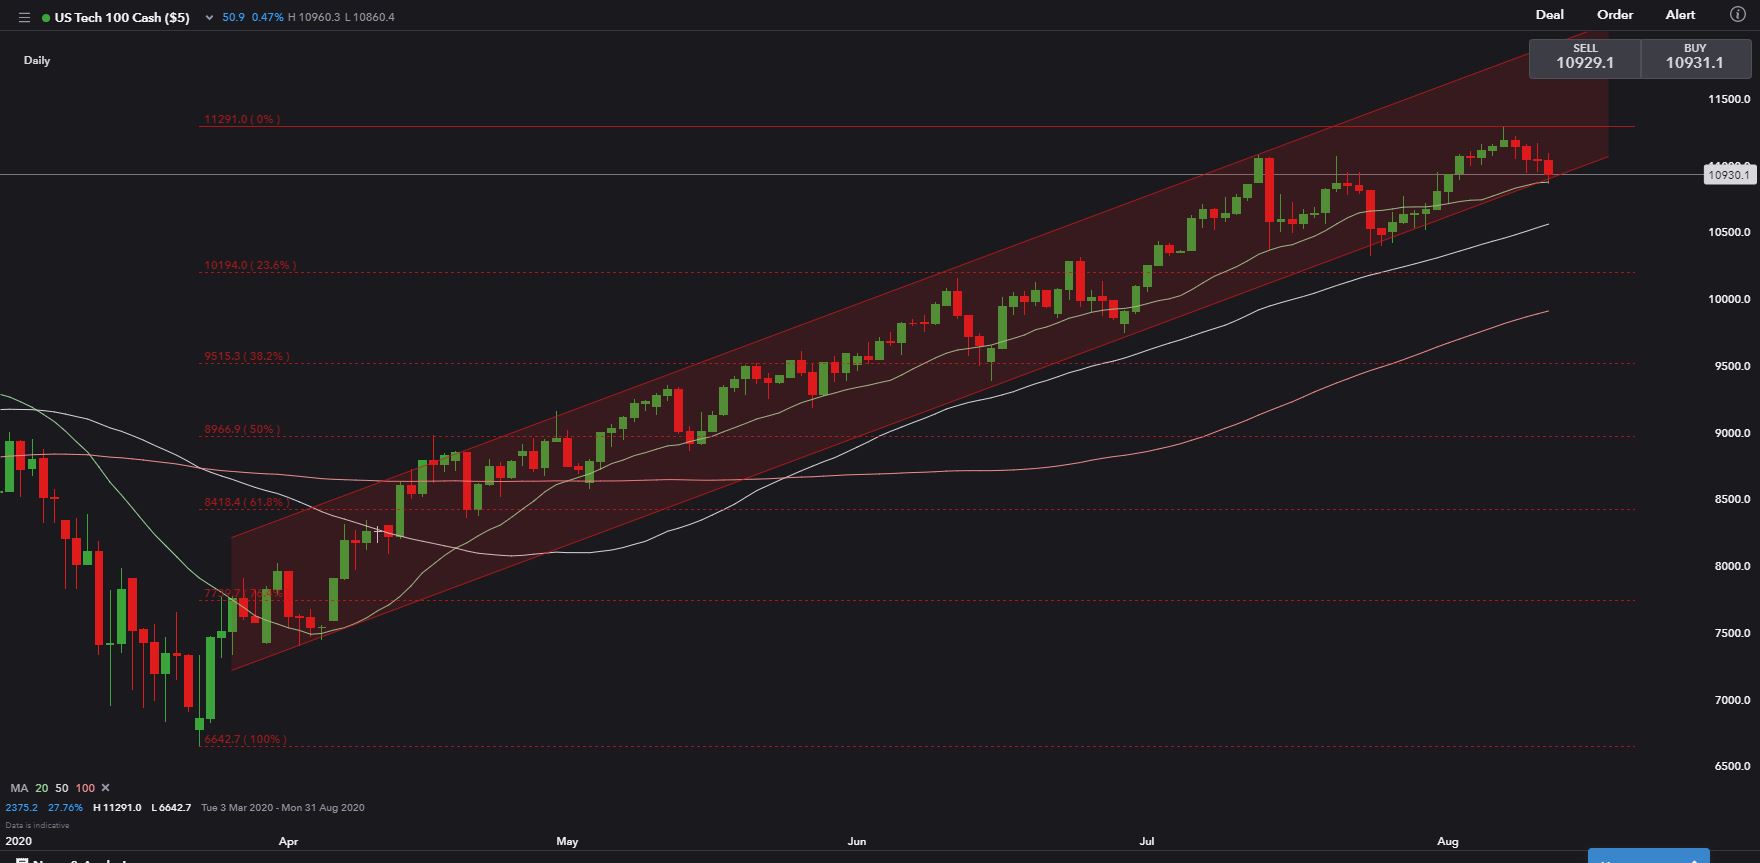
Technically, the Nasdaq has come to a key support level at 10,900 – the lower bound of its ‘ascending channel’ as drawn in the chart below. Breaking below this support would likely open the room for more downside towards the next support at 10,570 – the 50-Day Simple Moving Average (SMA) line. A deeper pullback may even come to the 23.6% Fibonacci retracement level at 10,190.
Nasdaq Index – Daily Chart
Nikkei 225 Index Outlook:
Japan’s Nikkei 225 stock benchmark entered into consolidation alongside the broader Asia-Pacific indices on Wednesday. Markets face a major test later this week when Washington and Beijing sits to review the phase-one trade deal. Market sentiment is tuning towards the cautious side against this backdrop.
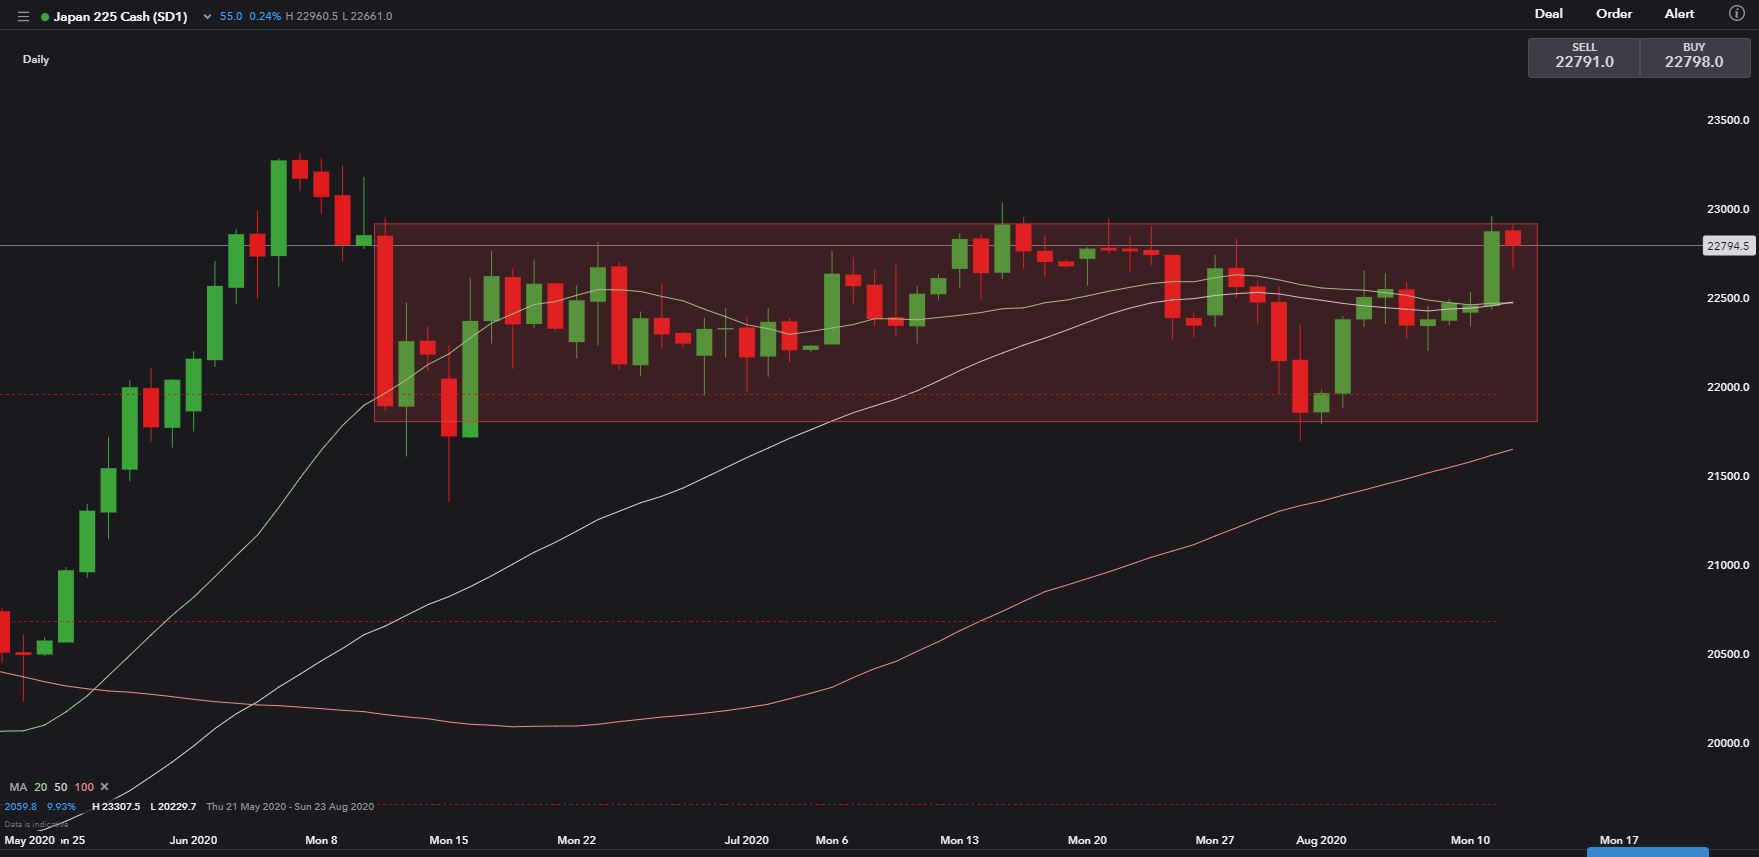
Technically, the Nikkei 225 failed to break above a key resistance level at 22,900 – the upper bound of its rangebound zone. The index may continue to consolidate between 22,000 to 22,900 in the days to come without clear catalysts. However, if the US market enters into a meaningful correction, the Nikkei may follow.
Nikkei 225 Index – Daily Chart
Gold Price Outlook:
Gold prices suffered from their largest two-day selloff since 2013, falling as much as 6% before extending losses during Wednesday’s APAC session. A stronger US Dollar and favorable macroeconomic data are weighing on gold prices. This consolidation may have more room to go as profit-taking activities kick in unexpectedly after an astonishing 14% gain over the past three weeks.
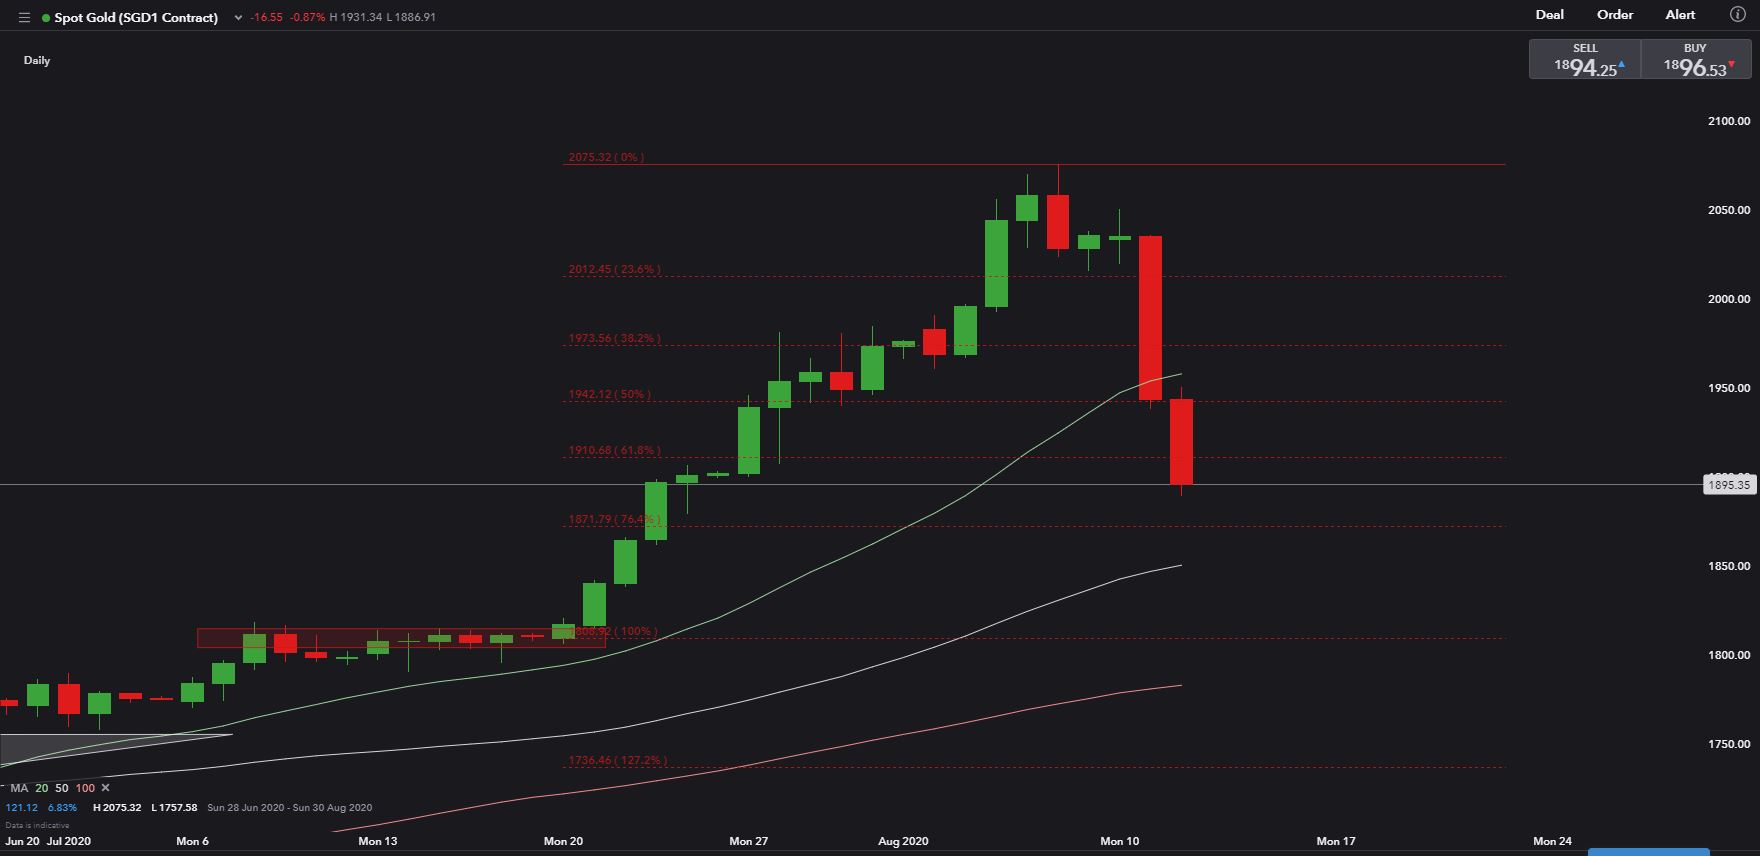
Technically, gold prices have reached the 76.4% Fibonacci retracement level at US$ 1,870 before bouncing slightly to US$ 1,890. If the US$1,870 support fails to hold, gold prices may drop further to test the next key support at US$ 1,808.
Gold Price – Daily Chart

--- Written by Margaret Yang, Strategist for DailyFX.com
To contact Margaret, use the Comments section below or @margaretyjy on Twitter


