


S&P 500, HANG SENG, ASX 200 INDEX OUTLOOK:
- S&P 500 index climbed 0.27% to a key resistance at 3,360. Futures dropped slightly
- Hang Seng index extended its consolidation as Tencent fell, eyeing key support at 24,400
- ASX 200 index challenges key resistance at 6,100 – the upper bound of ‘ascending triangle’
S&P 500 Index Outlook:
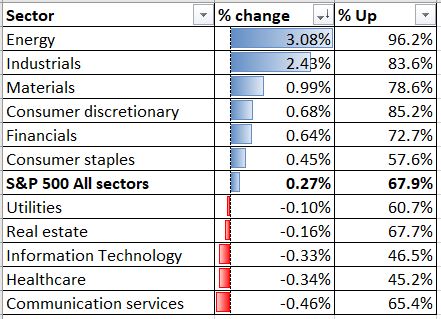
The S&P 500 index stock benchmark ended higher on Monday, lifted by cyclical-sensitiveenergy(+3.08%), industrials (+2.43%) and materials (+0.99%) sectors, whereas communication services (-0.46%), healthcare (-0.34%) and information technology (-0.33%) were lagging behind.
Boeing surged 5.52% last night to US$ 179.41, sending Dow Jones 1.3% higher. Boeing alone contributed 1% of Dow’s total gain. The US Transportation Security Administration announced that over 831k travelers were passed through US airports on Sunday – nearly a tenfold compared to the April level. Airline companies and energy firms were largely underpinned by favorable news.
TheTechnology sector, however, struggled to stay buoyant as Microsoft’s bid for TikTok’s US operations appeared to have stalled. Microsoft fell 1.99% to US$ 208.25, dragging the Nasdaq index 0.39% lower.
Today’s key economic data includes Japan’s current account balance, Australia’s business confidence reading and Singapore’s 2Q final GDP figure.
S&P 500 Sector performance 11-8-2020
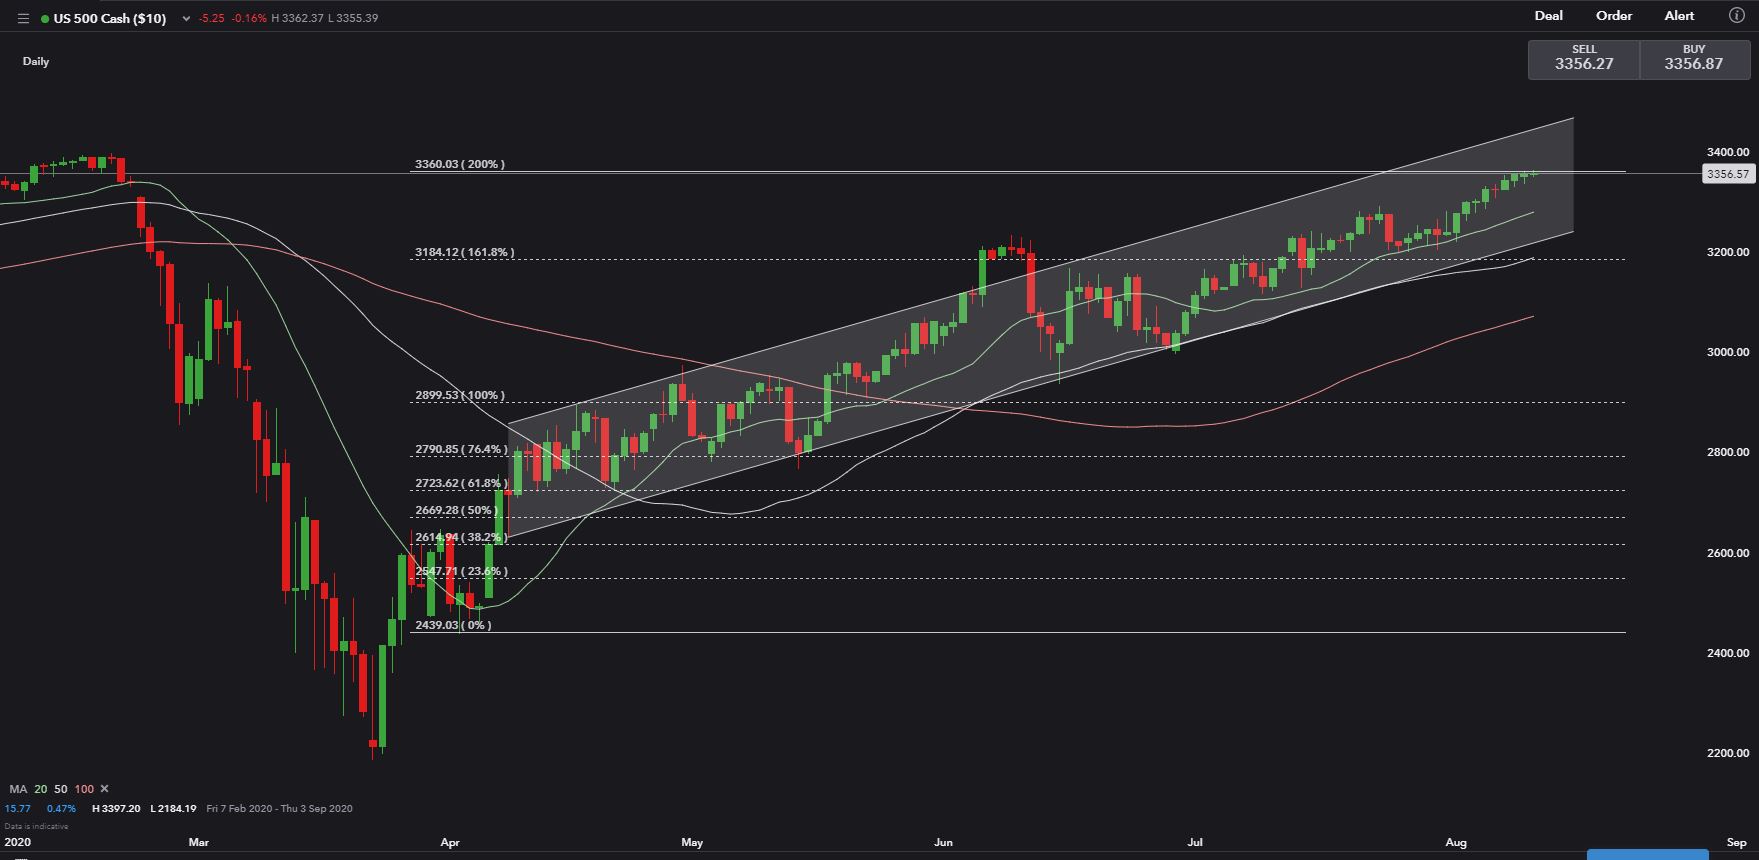
Technically, the S&P 500 index has reached a key resistance at 3,360 – the 200% Fibonacci extension. This level is also beneath its all-time high of 3,390 seen in mid-February this year. The index is trending up in a ‘ascending channel’ as plotted in the graph below, and its overall trend remains bullish.
S&P 500 Index – Daily Chart
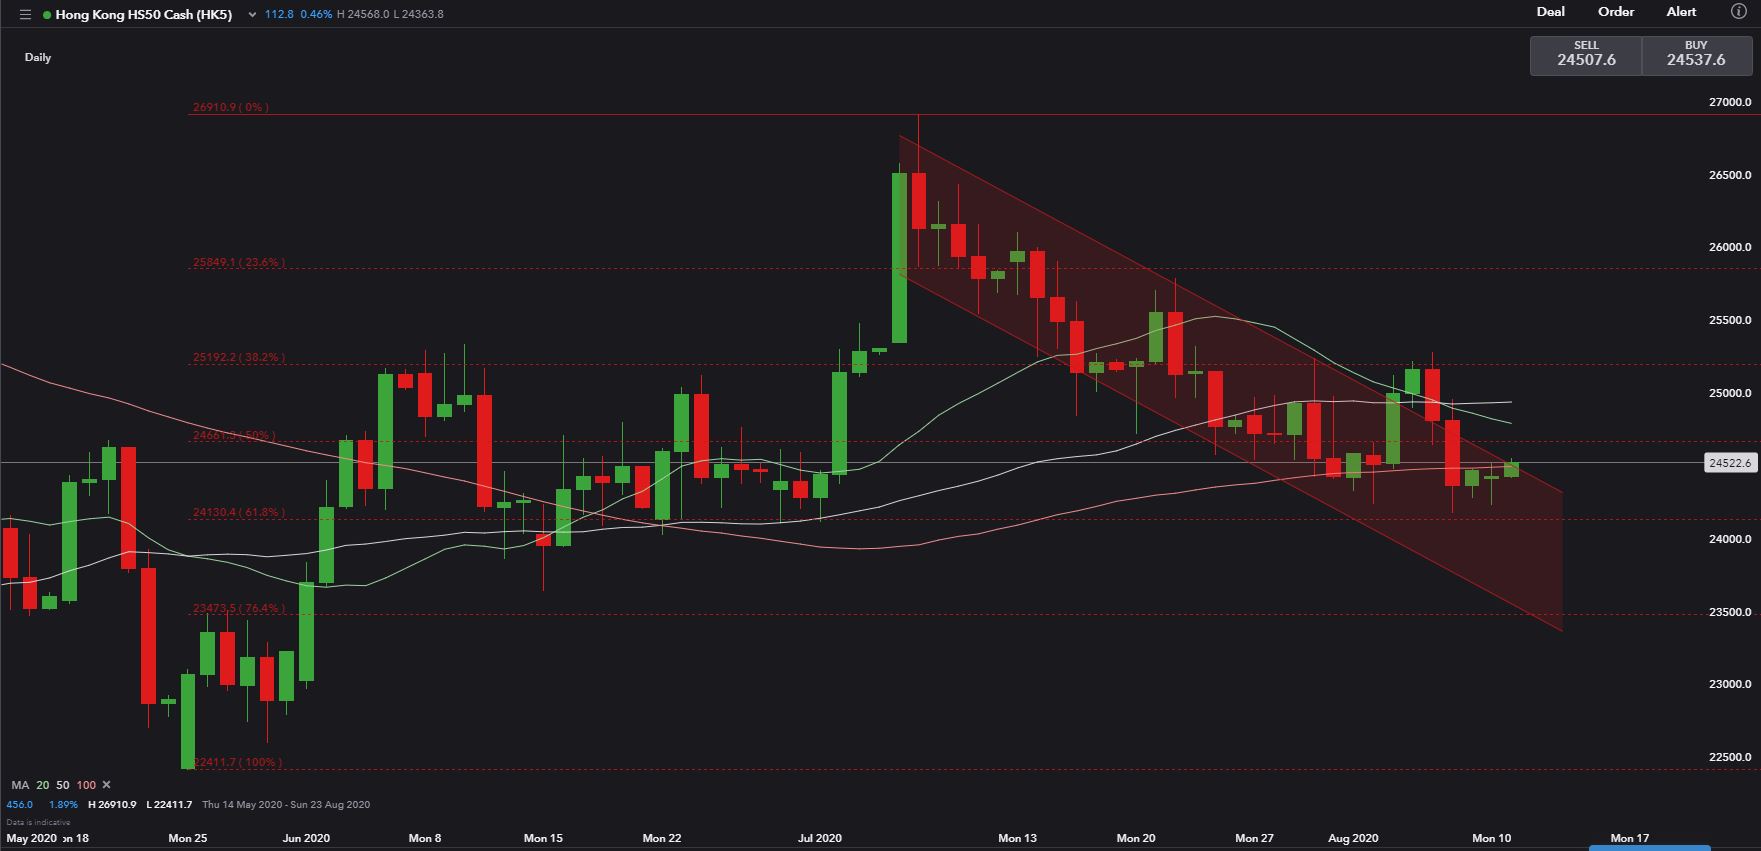
Hang Seng Index Outlook:
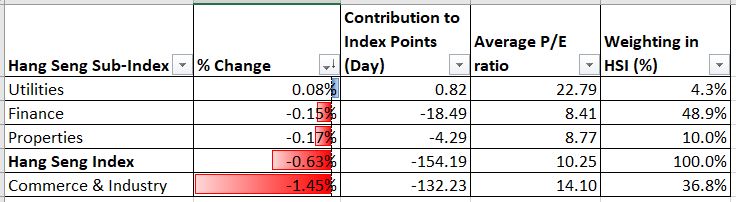
Hong Kong’s Hang Seng Index stock benchmark (HSI) extended its consolidation on Monday, falling 0.63% as Tencent plunged 4.83% on potential US sanctions. Other Chinese technology firms including Alibaba, Xiaomi and JD.COM also fell by a lesser extent.
Hang Seng’s performance has diverged from the Shanghai Composite these days, dragged by a poor domestic economy and ongoing US-China tensions. The Shanghai Composite has climbed to 3,379.25, which is only 2% below its high seen in early July. The overall trend remains bullish for the Shanghai Composite.
Hang Seng Index Sector performance 11-8-2020
Technically, Hang Seng is finding support at 24,400, breaking which will probably open room to more downside towards the 61.8% Fibonacci retracement at 24,130. The overall trend remains bearish in the near term as its 20-Day Simple Moving Average (SMA) has crossed below the 50-Day SMA.
Hang Seng Index – Daily Chart
ASX 200 Outlook:
Technically, Australia’s ASX 200 index is attempting to break a key resistance level at 6,100 – the upper bound of its ‘ascending triangle’ as drawn in the graph below. The index has attempted this a few times without a meaningful breakout. Investors are eyeing the approval of the US stimulus package for some positive catalysts. Rising commodity prices may also provide ASX with some solid support.
ASX 200 Index – Daily Chart


--- Written by Margaret Yang, Strategist for DailyFX.com
To contact Margaret, use the Comments section below or @margaretyjy on Twitter


