


Dow Jones & DAX 30 Price Outlook:
- Dow Jones and DAX 30 gains have slowed, yet bullish progress has continued
- That said, technology continues to lead the charge higher so the most explosive gains may be found elsewhere
- The New DAX Decade: The Past, Present and Future of the DAX 30
Dow Jones & DAX 30 Forecasts: Lagging Industrials Stymie Gains
The Dow Jones and DAX 30 have made little progress since early June as their components fail to capitalize on some of the more explosive gains seen in the technology sector. Consequently, the Nasdaq 100 has pressed to new heights while the Dow Jones and DAX 30 linger around the same levels they have for the better part of two months. While this is somewhat unsurprising, it does suggest that the same themes that have dominated global equity markets continue their stay at the helm of the recovery rally.

Chart created in TradingView
Therefore, a material shift in coronavirus recovery rally may be required before the indices with a more traditional exposure can really mount an attack higher. After almost six months of the outbreak globally and a litany of responses from governments, health officials and central banks, it seems a vaccine may be the final step necessary to help some of the beleaguered stocks. In the meantime, I am hesitant to suggest a serious shift in the performance between the high-flying Nasdaq and the slower Dow Jones and DAX 30.
Dow Jones Price Chart: 4 – Hour Time Frame (May 2020 – August 2020)
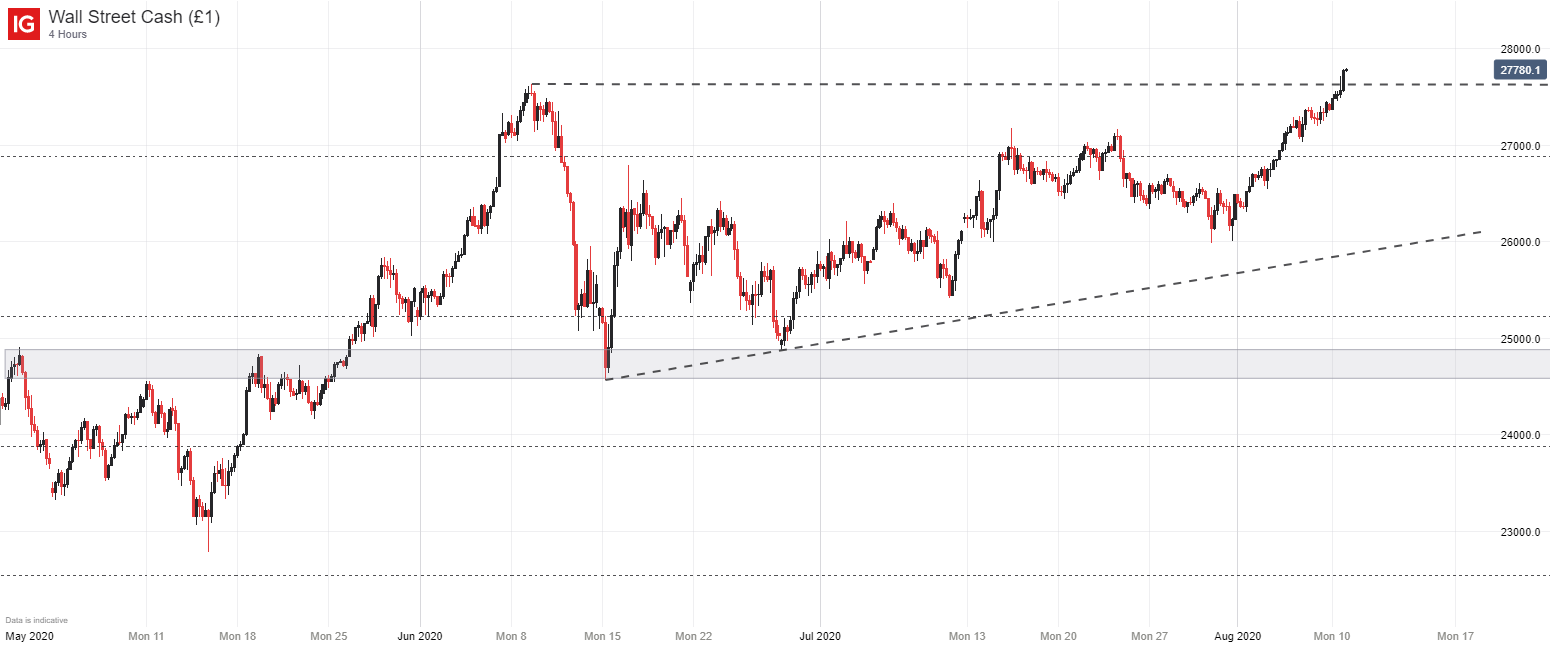
Nevertheless, all three are gradually floating higher. In the case of the Dow Jones, a recent breach above the June swing high could open the door to further gains in the near future – at least from a technical perspective. If a notable move higher can be established, traders may enjoy support from prior resistance.
| Change in | Longs | Shorts | OI |
| Daily | -18% | 18% | 7% |
| Weekly | -19% | 14% | 4% |
DAX 30 Price Chart: 4 – Hour Time Frame (March 2020 – August 2020)

Shifting our focus to the DAX 30, a similar technical pattern can be observed although the German equity index is devoid of a recent high like the Dow. Therefore, a similar break above resistance near 12,925 and 13,310 may be required before the DAX can look to established a new swing high. Follow @PeterHanksFX on Twitter for updates and analysis as the two indices look to continue their treacherous climb higher.
| Change in | Longs | Shorts | OI |
| Daily | -9% | 7% | 2% |
| Weekly | -27% | 9% | -5% |
--Written by Peter Hanks, Strategist for DailyFX.com
Contact and follow Peter on Twitter @PeterHanksFX


