


GBP Technical Outlook:
- GBP/USD trying to consolidate around confluent resistance
- GBP/JPY has breakout potential as long as it holds its ground
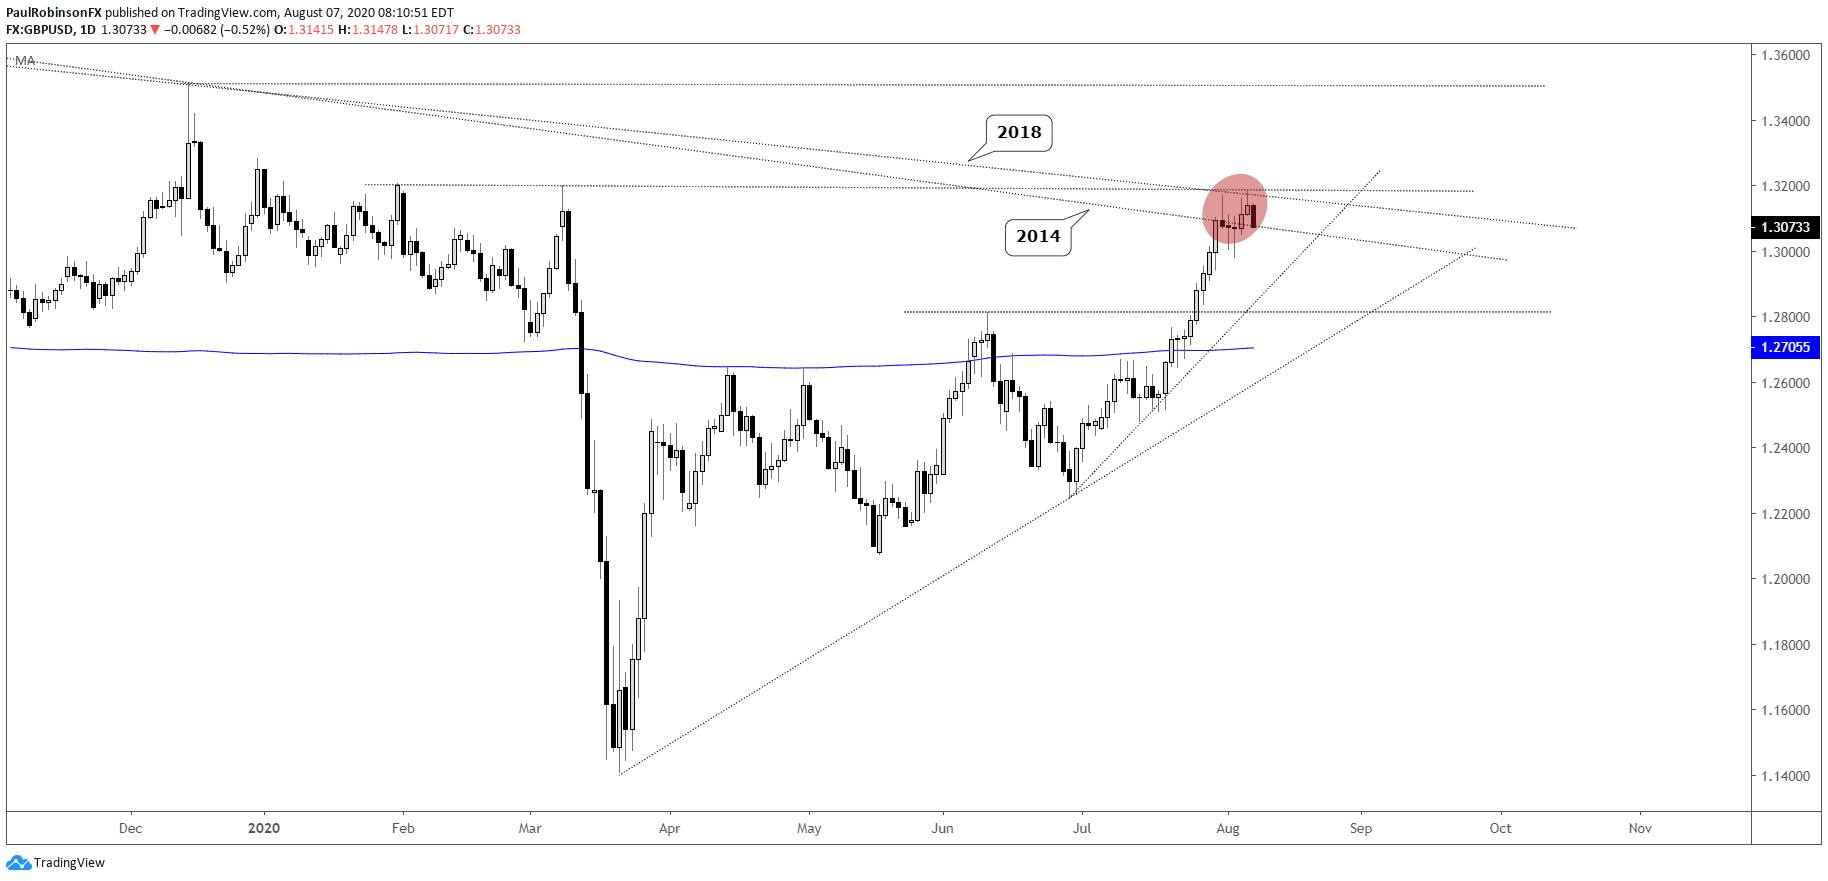
GBP/USD is trading around the 2014/2018 trend-line that is in confluence with a pair of swing-highs that developed prior to the coronavirus meltdown. It was anticipated to hold as a ceiling, but if cable can continue to hold its ground then we a consolidation pattern could lead to a breakout in the not-too-distant future. A breakout is seen as potentially leading to the December high over 13500. Should we see a strong pullback suddenly develop then we will need to reevaluate. A break under 12981 would likely bring in some added pressure that could accelerate price lower.

GBP/USD Daily Chart (trying to hold around confluent resistance)
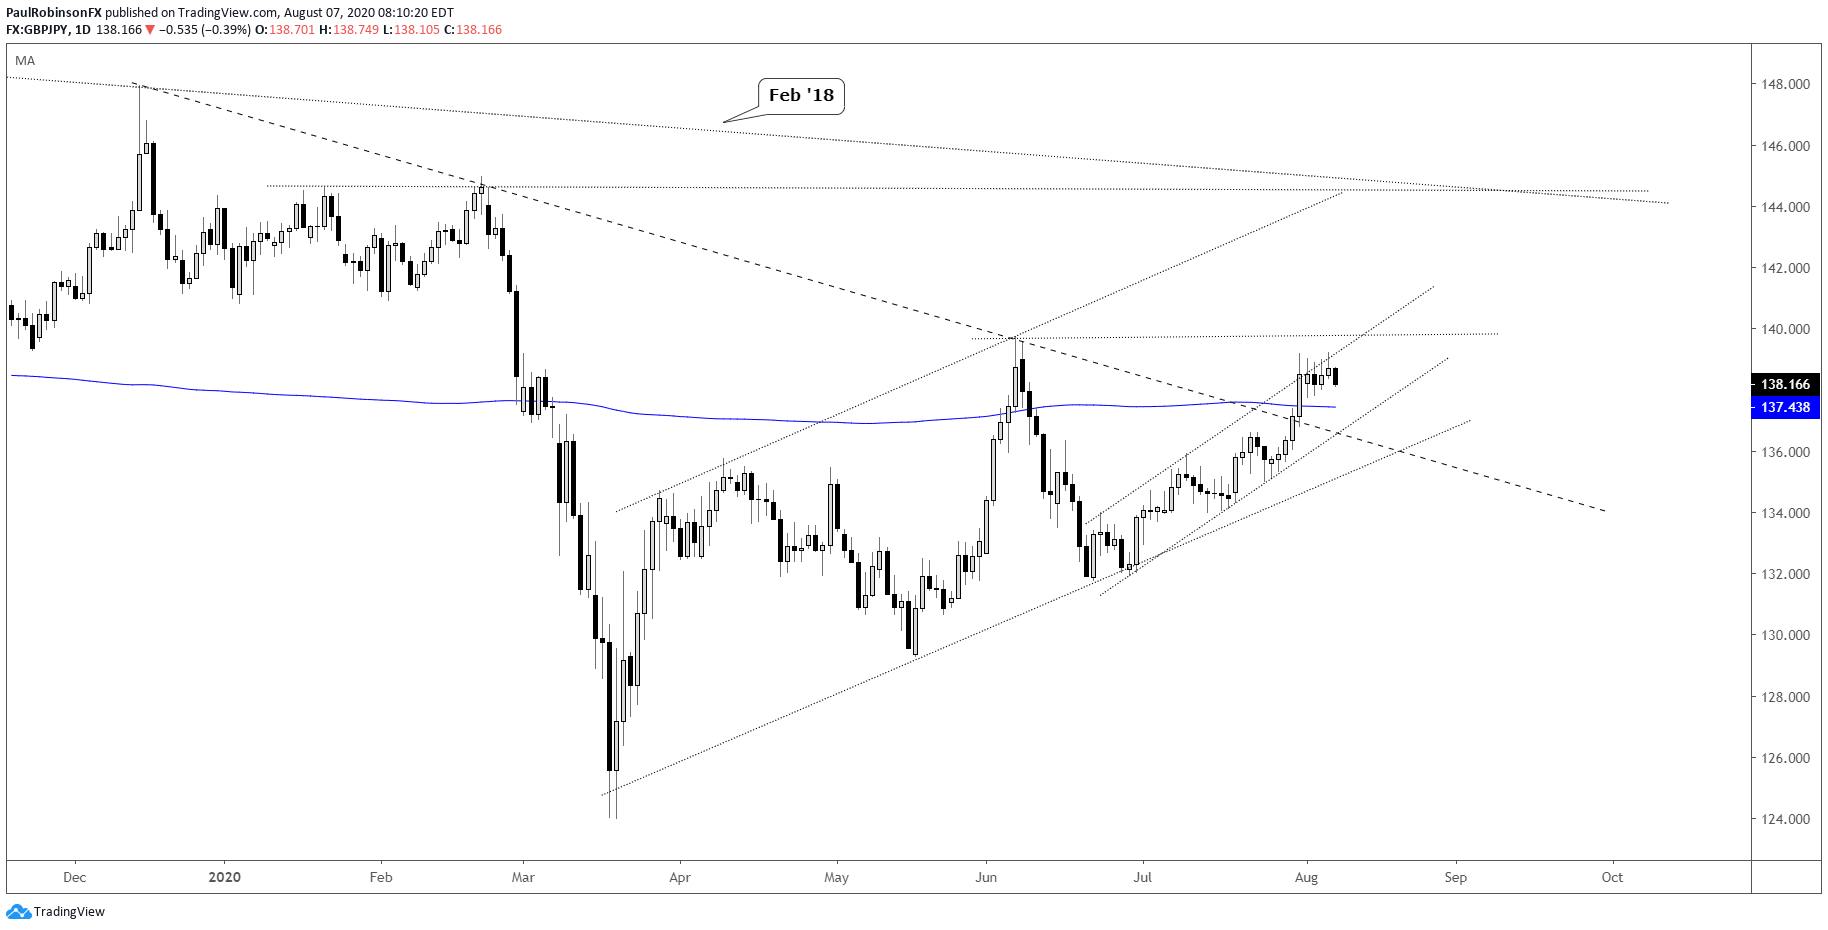
GBP/JPY has been trending higher at a slower pace than GBP/USD, but it did cross an important trend-line from December along with the 200-day MA. It is in an upward channel that if can be broken to the upside should lead to further gains. A breakout above the top of the channel and 13974 (June high) is seen as accelerating the trend, potentially towards the February 2018 trend-line around 14400. A near-term breakdown towards the bottom of the rising channel from June could offer traders a solid risk/reward opportunity to buy on a dip.
GBP/JPY Daily Chart (in channel for now)
For all the charts we looked at, check out the video above…
Resources for Forex Traders
Whether you are a new or an experienced trader, DailyFX has several resources available to help you; indicator for tracking trader sentiment, quarterly trading forecasts, analytical and educational webinars held daily, and trading guides to help you improve trading performance.
---Written by Paul Robinson, Market Analyst
You can follow Paul on Twitter at @PaulRobinsonFX


