


US DOLLAR OUTLOOK: USD PRICE ACTION ATTEMPTS REVERSAL AGAINST EURO & AUSSIE
- US Dollar notched a sharp 4% decline last month measured by the DXY Index
- USD aims to claw back recent downside as the Euro and Australian Dollar waver
- EUR/USD and AUD/USD rates may revert lower amid coronavirus second wave risk
The US Dollar is coming off its worst month of performance since April 2011 after a steep 4% slide lower in the DXY Index. USD price action stumbled across several major and emerging market currency pairs throughout July, but US Dollar weakness was noteworthy against its Euro and Australian Dollar peers in particular.

This has threatened the Greenback’s King Dollar title as a bearish trend begins to emerge with the broader DXY Index perched about 10% below March’s swing high. That said, with EUR/USD and AUD/USD edging lower over the last two trading sessions, the US Dollar is starting to show signs of life and brings potential for a larger reversal into focus.
DXY INDEX – US DOLLAR PRICE CHART: MONTHLY TIME FRAME (OCT 2010 TO AUG 2020)
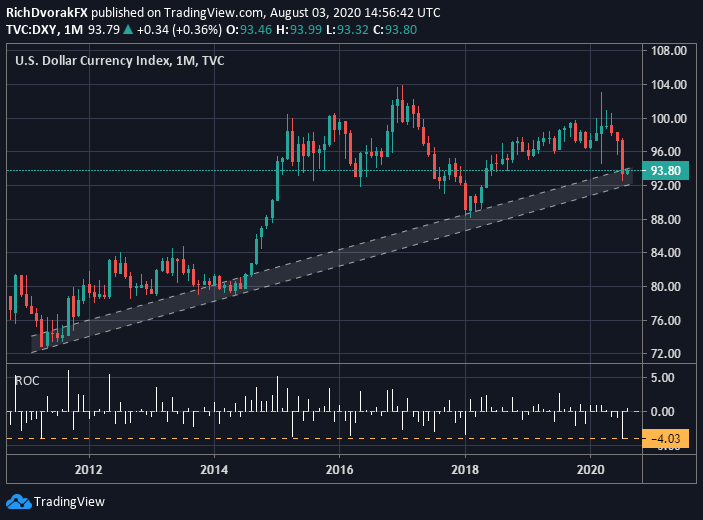
Chart created by @RichDvorakFX with TradingView
Looking at a monthly US Dollar Index chart reveals a long-standing bullish channel of support extended through a series of higher lows since 2011. Along with the chance for a possible mean-reversion higher, this zone of technical support may provide some buoyancy to the broader US Dollar and alleviate recent selling pressure despite extended USD swap lines.

Not to mention, a primary driver facilitating recent US Dollar weakness has likely included the prospect of diverging economic growth trajectories between the United States and other developed economies, such as the Eurozone or Australia. Shifting winds could cause this fundamental narrative to change in consideration of rising coronavirus second wave risk outside of the US, which may offer a catalyst sparking a bullish US Dollar reversal if this theme can garner more credence.
EUR/USD PRICE CHART: DAILY TIME FRAME (23 APR TO 03 AUG 2020)
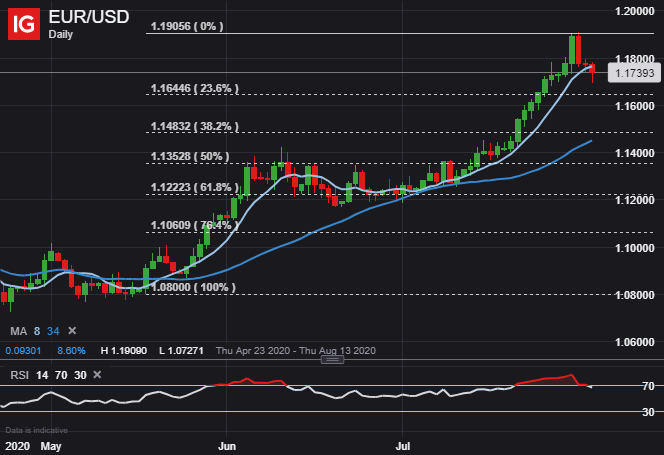
EUR/USD price action has already started to show signs that Euro bulls have grown exhausted. This is suggested by the noteworthy 200-pip tumble recorded by EUR/USD since Friday’s swing high and follows a possible double-top pattern at the 1.1900-handle.
| Change in | Longs | Shorts | OI |
| Daily | -1% | -4% | -3% |
| Weekly | 4% | -10% | -5% |
Further, spot EUR/USD now trades below its 8-day moving average as the relative strength index drifts lower out of ‘overbought’ territory. Maintaining the short-term moving average could indicate that EUR/USD bulls remain in the driver seat, but sliding below this technical barrier might signal a larger pullback could be in play.
AUD/USD PRICE CHART: DAILY TIME FRAME (29 FEB TO 03 AUG 2020)
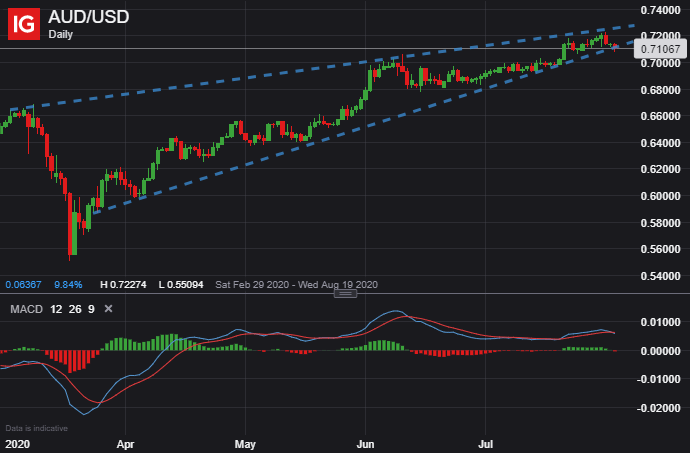
AUD/USD price action similarly shows recent US Dollar weakness abating. The pro-risk Aussie has slid over 100-pips against its US Dollar peer after breaching the 0.7200-price level late last week.
| Change in | Longs | Shorts | OI |
| Daily | 2% | 3% | 2% |
| Weekly | 29% | -46% | 0% |
This reiterates a possible bearish rising wedge pattern seemingly formed by AUD/USD throughout the year. Likewise, negative divergence shown on the MACD hints at waning upward momentum and potential for a reversal. A break beneath the lower support line could indicate the US Dollar may continue clawing back recent downside.
-- Written by Rich Dvorak, Analyst for DailyFX.com
Connect with @RichDvorakFX on Twitter for real-time market insight


