


USD/CADPrice Analysis:
- USD/CAD has continued to trade within the near-term range after BoC left interest rates unchanged.
- USD/CAD has thus far rebounded from an earlier-week sell-off, after yet another test of range support around the psychological 1.3500 handle.
- IG Client Sentiment shows 51.39% of USD/CAD traders are net long after additional short positions have been added over the last 24 hours
USD/CAD Trading Range Holds For Now
USD/CAD has bounced from range support, following Canadian Dollar strength in the prior day’s trading. The commodity-linked currency gained some ground against the US Dollar after BoC Officials voted to keep the benchmark interest rate at 0.25 percent. This drove USD/CAD down for a test of the same range support that’s been in-play for a month now; and again, buyers showed up to push prices higher.
Bigger picture - USD/CAD is still showing potential bearish tendencies due to the prior short-side trend, which ensued after the March high. The current period of consolidation follows closely from a breakdown of the descending triangle that built in late-May; and as yet, USD/CAD price action has not re-tested those levels. While a descending triangle is usually a continuation pattern, it’s not unusual for the descending triangle to be found around market tops.
Adding further to the prospect of bearish potential is the appearance of the MACD indicator on the Daily chart, depicting a slowdown of momentum and a possible bearish MACD crossover (blue circle). The 21, 55 and 100 simple moving averages (SMA) further fuel a bearish viewpoint as they are yet to provide any bullish crossovers (21<55<100).
USD/CAD Daily Chart

Chart prepared by Richard Snow, IG
USD/CAD Strategy Moving Forward
The chart below frames the trading range between the upper bound at 1.3716 and the lower bound at 1.3491. A bearish set up would have traders eye the lower bound of the range for a potential break below this level. Further losses would bring into focus the next considerable level, around the approximate 1.3383 handle.
The 4-hour chart however, may be of great interest to bullish USD/CAD traders as the stochastic oscillator has advanced off oversold levels and is yet to cross into overbought territory. Bulls may keep an eye on the most recent high of 1.3647 and further upward momentum may highlight the top of the trading range at 1.3716.
USD/CAD 4-Hour Chart
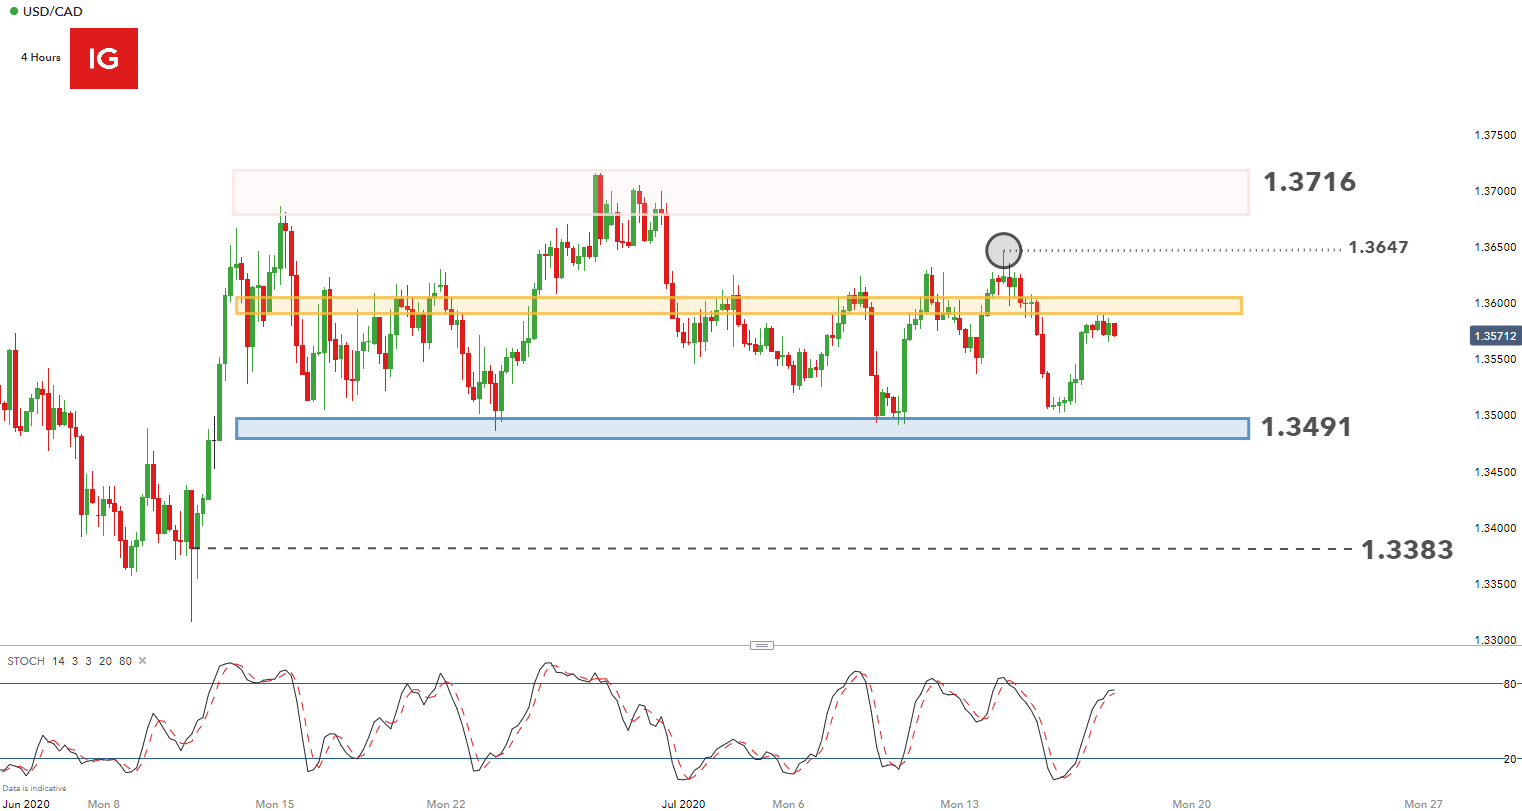
Chart prepared by Richard Snow, IG
IG Client Sentiment – How Are USD/CAD Traders Currently Positioned?
| Change in | Longs | Shorts | OI |
| Daily | -2% | 7% | 5% |
| Weekly | -30% | 38% | 13% |
- When analyzing client sentiment using the net figure, a slight majority of USD/CAD traders are bullish with a 51.39% long reading.
- The number of traders net-long is 29% lower than yesterday and 15.85% higher from last week, while the number of traders net-short is 52.95% higher than yesterday and 5.94% lower from last week.
- Positioning is less net-long than yesterday but more net-long from last week. The combination of current sentiment and recent changes would ascribe a ‘mixed’ reading.
--- Written by Richard Snow for DailyFX.com
Contact and follow Richard on Twitter: @RichardSnowFX


