


Technical Outlook:
- GBP/USD below support, acting weak
- GBP/JPY bouncing off support but could weaken
- DXY broke short-term corrective pattern
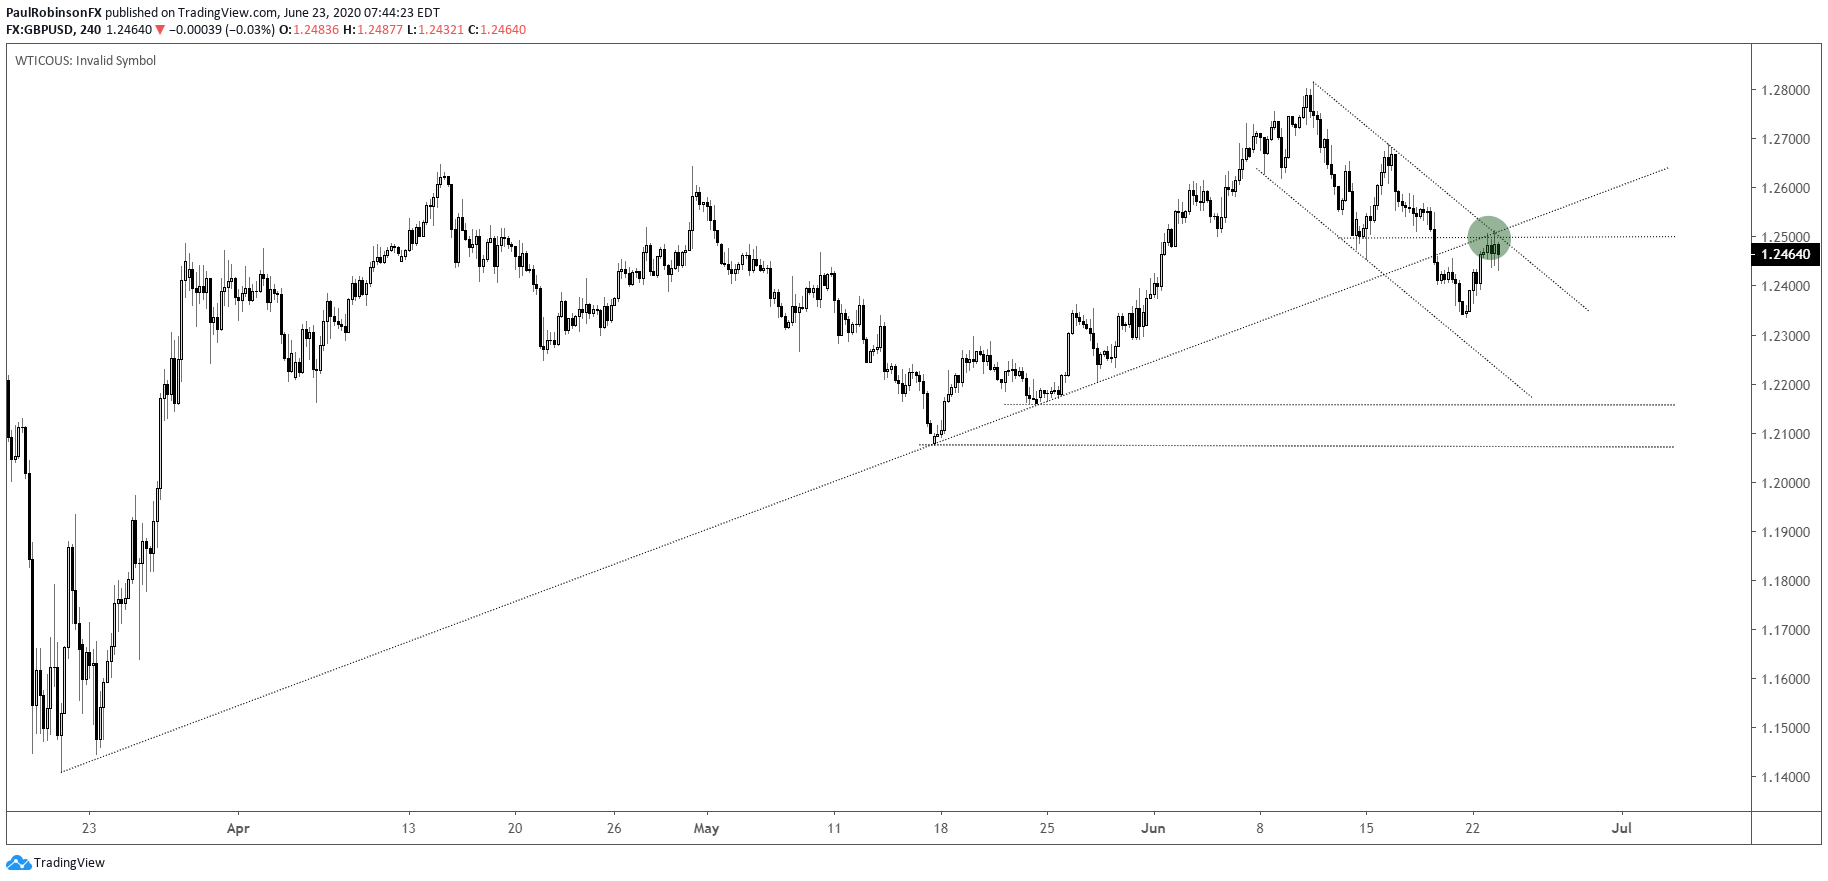
The GBP/USD is below a trend-line and the most recent swing-low, putting in position to sink further. This morning it tested former support, now resistance, and thus far turning down. Staying below ~12540 will be important for the bearish outlook. If selling pressure reasserts itself we could see a move down towards the 122/12100-area.

GBP/USD 4-hr Chart (at pivotal spot)
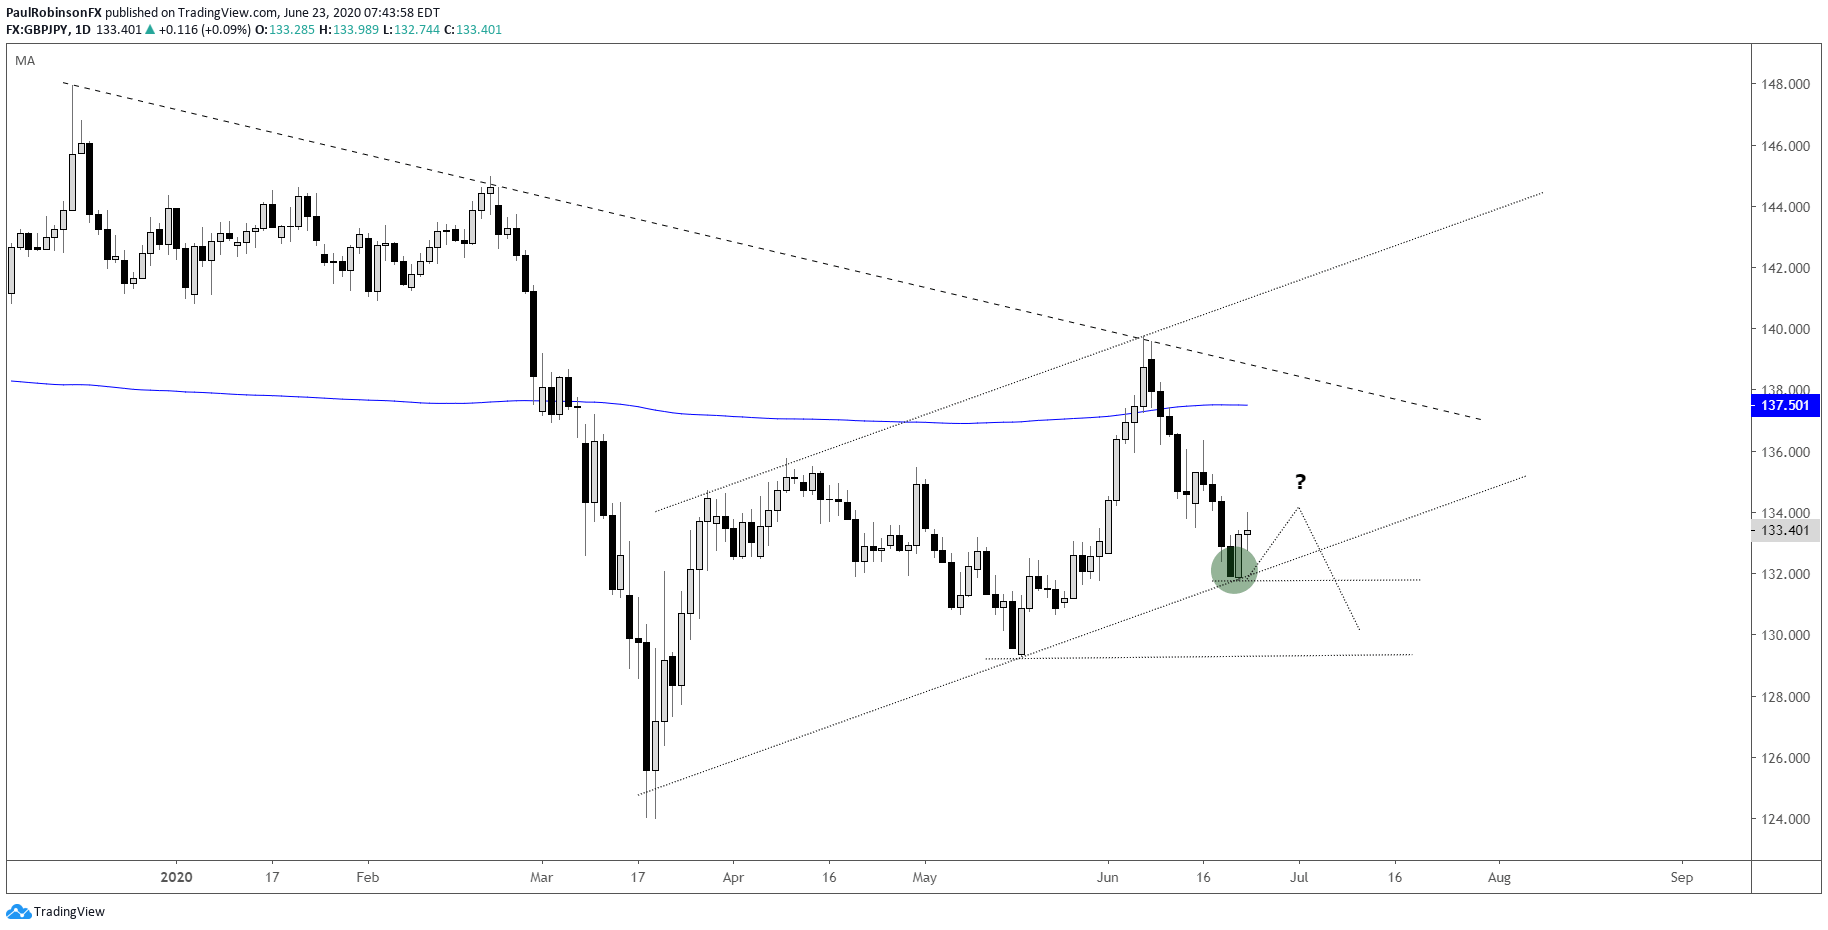
GBP/JPY is bouncing off a lower parallel, but like GBP/USD it could be in trouble here soon if it can’t hold a bid. A decline below 13175 will put the pair in position to drop further and have it below the lower parallel.
GBP/JPY daily Chart (lower parallel)
DXY broke a short-term corrective pattern within a trend, which implies that we should see lower levels ahead. There is a trend-line from 2018 below around the 95.80 level that could keep the Dollar from falling too far. But nevertheless the near-term path of least resistance looks lower.
DXY 4-hr Chart (broke wedge)

For all the charts we looked at, check out the video above…
Resources for Forex Traders
Whether you are a new or an experienced trader, DailyFX has several resources available to help you; indicator for tracking trader sentiment, quarterly trading forecasts, analytical and educational webinars held daily, and trading guides to help you improve trading performance.
---Written by Paul Robinson, Market Analyst
You can follow Paul on Twitter at @PaulRobinsonFX


