


CHINA A50 INDEX, CRUDE OIL, GOLD PRICE OUTLOOK:
- Stocks across Asia-Pacific posit to open higher as sentiment improves overnight
- Brent crude oil price extends its seventh-day gain and reaches a three-month high of US$ 41.0
- Underpinned by a weaker US Dollar, gold price breaks above key resistance at US$ 1,450
China A50 Index Outlook:
Despite mounting concerns over a potential second viral wave, the S&P 500 futures still managed to rebound from deep losses and closed higheron Monday. A swing back in risk appetite may help to fuel a rally in Asia-Pacific stocks, which have shown resilience against external headwinds recently. Among the S&P 500 sectors, technology (+1.93%), utilities (+1.34%), consumer discretionary (+1.1.%) and energy (+0.63%) were the best performing ones, whereas financials (-0.48%), health care (-0.36%) and consumer staples (-0.27%) were the worst hit last night.
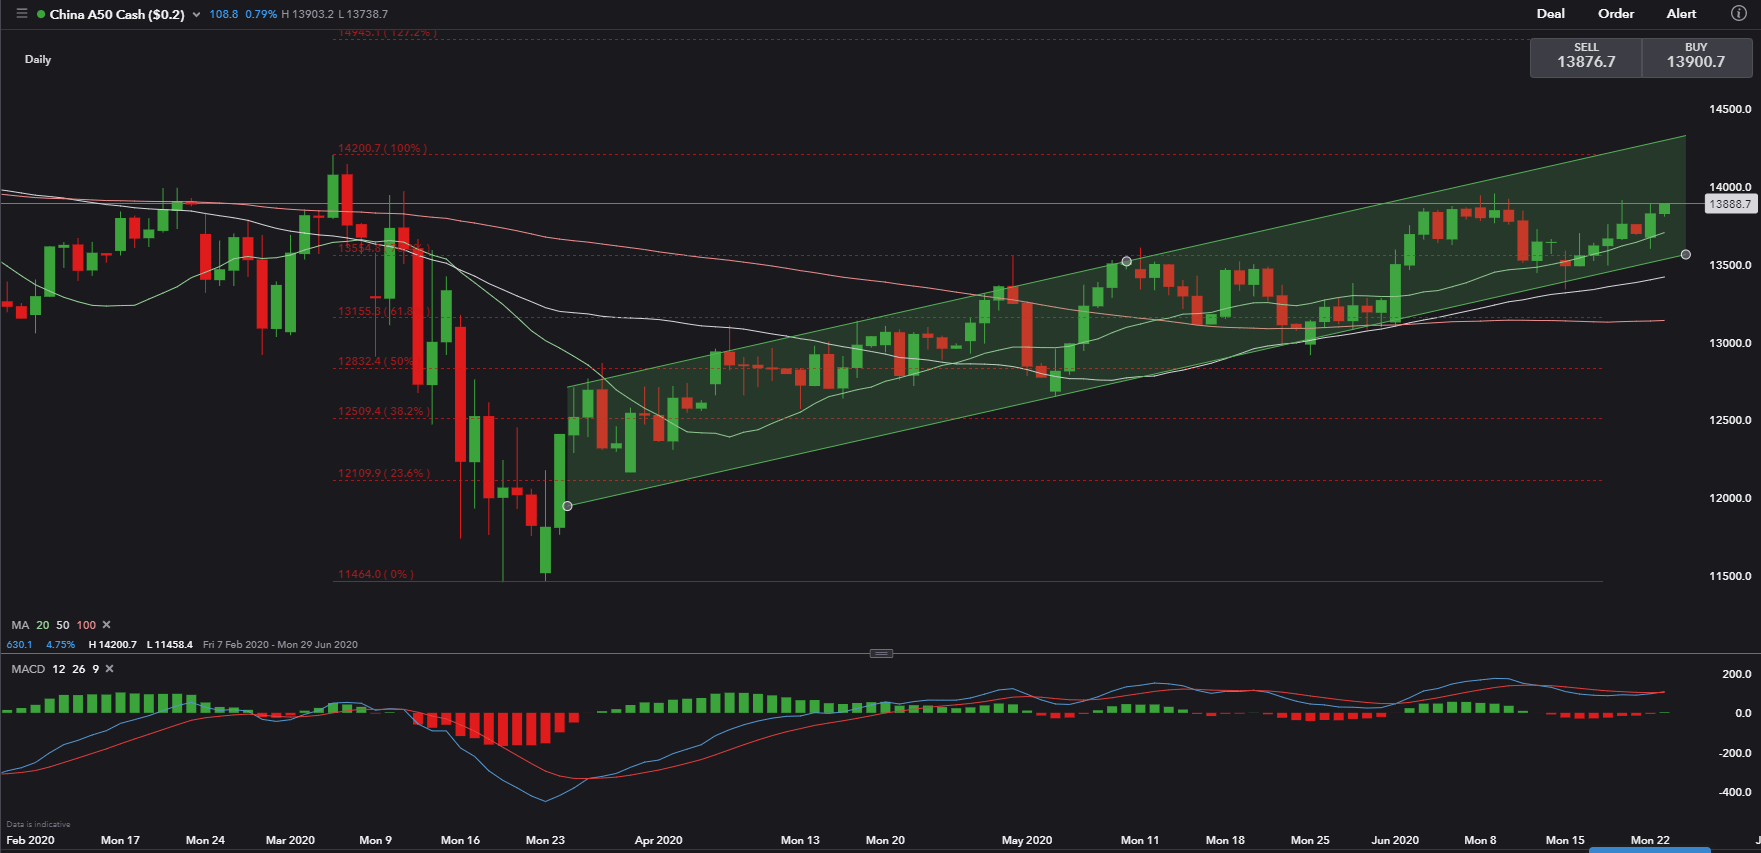
The new Covid-19 cluster found in Beijing was reported to have been brought under control, and China has strengthened measures to contain a potential resurgence in cases, both domestic and imported. The FTSE China A50 Index stock market benchmark, a good barometer of China A-share market sentiment, continues to trend up in an Ascending Channel formed since early April. China A50 futures have risen by 0.73% to 13,800, a two-week high this morning.
The currency market is also in a ‘risk-on’ mood, with growth-linked Australian Dollar and New Zealand Dollars outperforming other G10 currencies. The petroleum-linked Canadian Dollar and Norwegian Krone are up too, thanks to rising crude oil prices.
FTSE China A50 – Technical Analysis
The FTSE China A50 index is trending up within an Ascending Channel (chart below) formed since early April. Its 20-, 50- SMA have crossed above its 100-Day SMA, forming a ‘golden cross’. It suggests the index may embrace more upside potential in the mid to long term.
Immediate support and resistance levels can be found at 13,550 and 14,200, which are the 76.4% and 100% Fibonacci retracements respectively. A pullback below the lower bound of this channel, which is now at around 13,500, will likely lead to a reversal in trend and thus a deeper correction.
FTSE China A50 Index
Brent Crude Oil – Fundamental and Technical Analysis
Brent oil prices extend its seventh-day rally in an attempt to fill the upside gap formed in early March, when a price war broke out between Saudi Arabia and Russia. Recent gains in crude oil prices are partially based on the assumption that the worst is behind for the aviation industry as more economies are ready to open, and that OPEC+ will fulfill the production cut commitments.
Barring material changes in the above assumptions, crude oil’s upward trend may stay intact. The downside risks include a potential setback in opening-up nations if there is a severe viral resurgence in the US, and potential rising rig counts as higher crude oil prices attract more suppliers to the market.
Immediate support and resistance levels could be found at US$ 36.36 (50% Fibonacci retracement) and US$ 43,23 (61.8% Fibonacci retracement) respectively. The upward trend remains intact.

Gold Prices – Fundamental and Technical Analysis
After a long period of consolidation, gold prices have finally attempted a meaningful breakout above US$ 1,750 – a major resistance level. A plunge in the US Dollar overnight and rising demand for inflation-hedge assets have probably sent gold prices higher. Does this rally have legs? Well, it may depend on the direction of the US Dollar index and Covid-19 situations in the United States in the days to come.
Gold prices have likely broken out above an ‘Ascending Triangle’ after piercing through US$ 1,750. US$ 1,750 is not only the upper bound of the Ascending Triangle, but also its 100% Fibonacci extension level, and thus very critical. Holding above this level will likely open room for more upside towards the US$ 1,800 area. The MACD indicator suggests there could be more upside in the near term.
| Change in | Longs | Shorts | OI |
| Daily | 1% | -3% | -1% |
| Weekly | 2% | -8% | -2% |

--- Written by Margaret Yang, Strategist for DailyFX.com
To contact Margaret, use the Comments section below or @margaretyjy on Twitter


