Crude Oil Forecast:
- Crude oil has edged higher in the last ten days as risk-sensitive assets regain their footing
- Now, the commodity nears its 200-day simple moving average and horizontal resistance
- Will fresh highs translate to further bullishness and a continuation higher?
Crude Oil Price Outlook: WTI Edges Above Recent High, Will it Break Out?
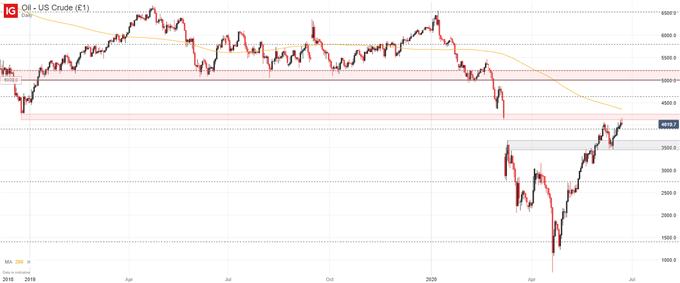
Risk-sensitive assets have been on the road to recovery following the aftermath of the June 10 Fed meeting, with crude being one of the assets that has returned to surpass recent highs. As a result, the commodity has moved within reach of a few important technical barriers that may give pause to an attempted continuation. Either way, the fate of crude likely rests in the hands of broader risk appetite, which has recently been susceptible to quick pullbacks as investors juggle covid concerns with economic stimulus.
Crude Oil Price Chart: Daily Time Frame (December 2018 – June 2020)

With that in mind, crude’s price outlook is heavily tied to economic activity projections as an indicator of demand. Thus, any indication that a second coronavirus wave might spur a secondary lockdown period could also seriously undermine crude prices with little notice. As it stands, however, recent manufacturing PMI data has offered an encouraging tailwind regarding economic production, so immediate concerns may be soothed in that arena but the risk will remain.
Therefore, it seems crude is at the mercy of market sentiment in the days ahead. If bullish appetite persists, possible resistance around the $41.11 mark might act as an early barrier which is closely followed by the 200-day simple moving average around $43.50. Together, the technical levels should look to fight off bullish intentions, but the recent higher-high is an encouraging technical sign to be sure.
| Change in | Longs | Shorts | OI |
| Daily | 3% | -7% | 1% |
| Weekly | 31% | -38% | 7% |
If surpassed, the levels may pave the journey higher for an eventual attack of the psychological $50 mark. On the other hand, crude oil might enjoy buoyancy near the $35.00 mark which has seemingly offered assistance to price in the past. In the meantime, traders should track broader changes in risk appetite for clues regarding crude oil’s recovery prospects while taking advantage of technical levels to provide attractive risk-reward set ups.
--Written by Peter Hanks, Analyst for DailyFX.com
Contact and follow Peter on Twitter @PeterHanksFX


