Technical Outlook:
- US Dollar Index (DXY) trying to mount a rally, has a pattern needs to snap
- GBP/USD breaking down below support
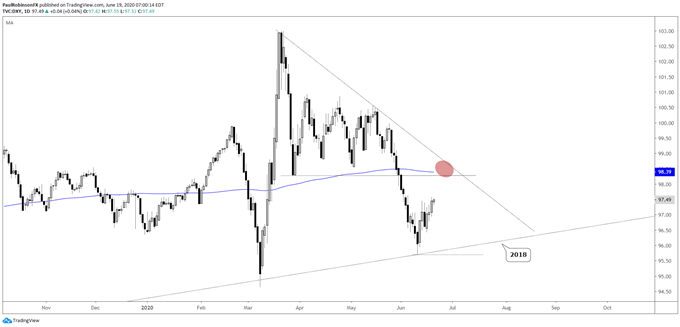
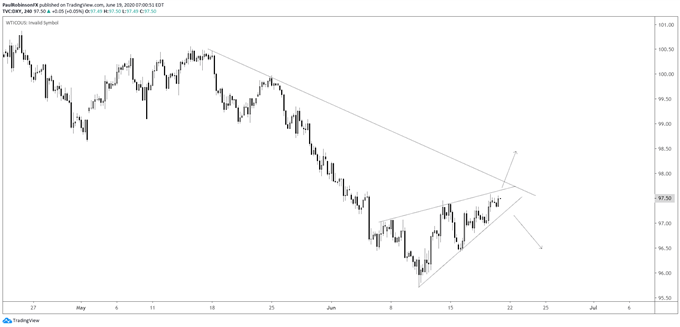
The US Dollar Index (DXY) is trying to continue its rebound off the 2018 trend-line, but does have a potentially bearish sequence it needs to avoid triggering on the short-term chart. Looking at the 4-hr chart there is an ascending wedge, and given it is in the context of a downtrend it implies we could see another drive back lower. If the underside of the trend-line this will be caution for at least a retest of the 2018 trend-line. But if it can break on outside the top of the pattern, most likely Euro-driven given the currency is 57% of the index, then a run to resistance between 98.35 and 98.85 could continue. Reaching that area would be an important one to watch, as there is a significant swing-low from March, the 200-day MA, and a trend-line from the March high. Could become a very important inflection point.


US Dollar Index (DXY) Daily Chart (2018 t-line, confluent resistance ahead)

US Dollar Index (DXY) 4-hr Chart (wedge)

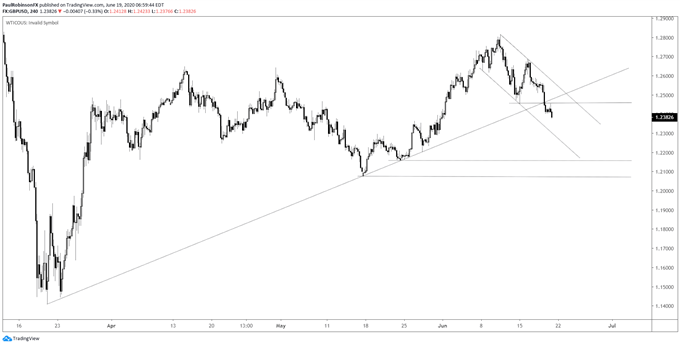
GBP/USD broke an important threshold of support via the trend-line rising up from the March low under inflection points during May. The trend-line was also in confluence with the June 15 low, which was just retested in earlier trade. This has focus squarely shifted on the downside. The next sizable level of price support doesn’t arrive until the May 18 low at 12075. There is minor support before then just under 12200.
GBP/USD 4-hr Chart (broke support)

For all the charts we looked at, check out the video above…
Resources for Forex Traders
Whether you are a new or an experienced trader, DailyFX has several resources available to help you; indicator for tracking trader sentiment, quarterly trading forecasts, analytical and educational webinars held daily, and trading guides to help you improve trading performance.
---Written by Paul Robinson, Market Analyst
You can follow Paul on Twitter at @PaulRobinsonFX


