


UK Q1 GDP and Sterling Price Analysis:
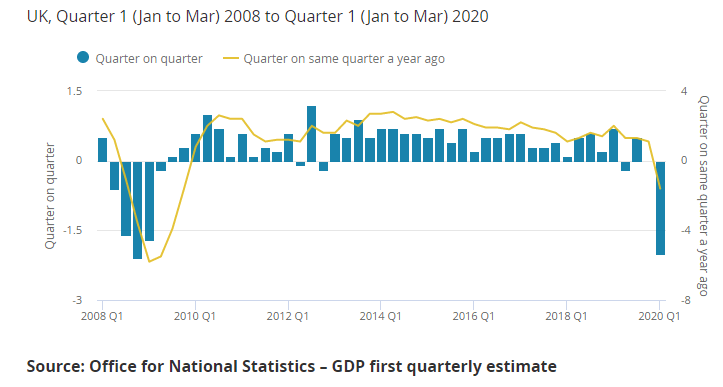
- UK Q1 GDP fell by 2% following a flat reading in Q4 2019.
- Monthly GDP (March) fell by 5.8%

UK Q1 GDP – Better Than Expected But UK Economic Outlook Remains Dire
UK first quarter GDP contracted by 2.0%, official data from the ONS revealed today, the largest quarterly contraction since the 2008 global financial crisis. The economy fell by 1.6% compared with Q1 2019, while the monthly figure fell by 5.8%. All figures beat market estimates but the ONS warned that updates to the data ‘are likely to have larger than usual revisions’.
Earlier today, figures released by the British Retail Consortium (BRC) showed a record fall in retail sales. Commenting on the release, Paul Martin, Partner, UK Head of Retail KPMG wrote, ‘With the nation firmly under lockdown throughout April, drastic sales declines were to be expected. Total sales fell a staggering 19.1% compared to last year – but that pain wasn’t felt equally’.
For all market moving events and data, see the newly improved DailyFX Calendar
GBP/USD price action post-UK GDP release was relatively muted with the pair trading just under 1.2300. Tuesday’s sell-off saw the April 21 low at 1.2274 tested and Sterling is likely to remain under pressure. GBP/USD is trading below all three moving averages, although it has yet to conclusively break the 50-dma, and continues to make a series of lower highs. If 1.2247 is broken, 1.2165 and 1.2095 come into view.
| Change in | Longs | Shorts | OI |
| Daily | 3% | -7% | -3% |
| Weekly | 4% | -10% | -5% |
GBP/USD Daily Price Chart (September 2019 – May 13, 2020)

Traders may be interested in two of our trading guides – Traits of Successful Traders and Top Trading Lessons – while technical analysts are likely to be interested in our latest Elliott Wave Guide.
What is your view on Sterling (GBP) – bullish or bearish?? You can let us know via the form at the end of this piece or you can contact the author via Twitter @nickcawley1.


