


US DOLLAR FORECAST POST-FOMC: DXY INDEX, EUR/USD, AUD/USD PRICE CHART SETUPS & TRADE LEVELS
- DXY Index dropped to session lows as the US Dollar sank in response to a monetary policy update from the Federal Reserve
- EUR/USD at risk of reversal considering the ECB meeting on deck might send the Euro lower against its US Dollar peer
- AUD/USD price outlook could remain constructive thanks to Fed liquidity and coronavirus optimism
The US Dollar declined for a fourth consecutive trading session on Wednesday. The US Dollar experienced renewed selling pressure after the FOMC rate decision crossed the wires. US Dollar downside then accelerated on the back of dovish remarks from Fed Chair Powell.

The DXY Index, a basket of major currency pairs that reflects US Dollar performance broadly, trades 1.4% below its April 24 intraday high due to the ongoing stretch of US Dollar weakness. DXY Index price action now probes a critical technical support level, however, that might send the US Dollar catapulting back higher.
DXY INDEX PRICE CHART: DAILY TIME FRAME (26 DECEMBER 2019 TO 29 APRIL 2020)
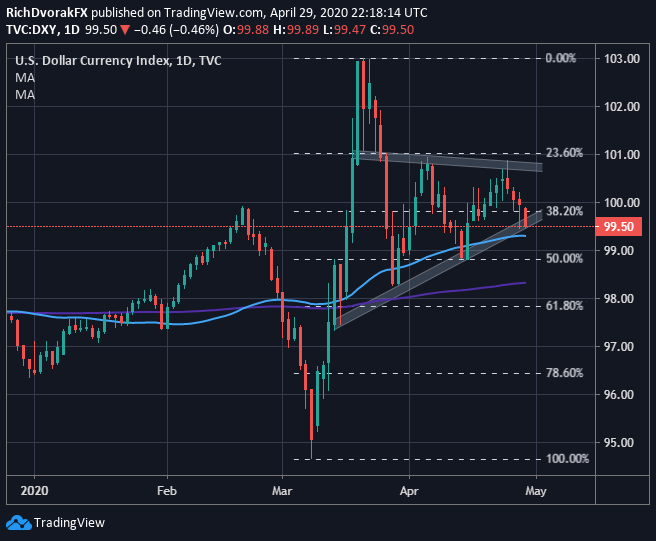
Chart created by @RichDvorakFX with TradingView
US Dollar downside may soon subside with the DXY Index potentially finding buoyancy around the 99.25 to 99.50 price zone. This level of technical confluence is underpinned by its 50-day moving average and positively-sloped trendline extended through the series of higher lows since March 13.
Also, despite US Dollar selling pressure throughout the session, which was exacerbated by word that Powell expects the Fed to do more in terms of its liquidity efforts to combat the likely unavoidable coronavirus recession, it is noteworthy that the DXY Index failed to take out the prior intraday low.

If the US Dollar fails to find support around the aforementioned technical level, the DXY Index could stretch lower toward its next area of support near the 99.00 handle and mid-point retracement of last month’s trading range before the 200-day moving average comes into focus.
EUR/USD PRICE CHART: DAILY TIME FRAME (25 JANUARY TO 29 APRIL 2020)

EUR/USD continued its rebound since the most liquid and heavily traded currency pair plunged below 1.08 as the EU Summit failed to deliver a coordinated coronavirus stimulus response last week. The bullish MACD crossover hints at potential for a bigger advance if upward momentum gains pace and sees follow-through.
| Change in | Longs | Shorts | OI |
| Daily | -14% | 9% | -4% |
| Weekly | -23% | 33% | -4% |
Although, with the European Central Bank on deck to provide markets with its own monetary policy update, spot EUR/USD price action could whipsaw back lower. EUR/USD might reverse if the ECB meeting reveals the central bank intends on boosting its bond buying program or other increasingly accommodative monetary policy measures.
AUD/USD PRICE CHART: DAILY TIME FRAME (26 DECEMBER 2019 TO 29 APRIL 2020)

US Dollar weakness is particularly evident when observing recent AUD/USD price action. Recent strength in spot AUD/USD is also indicated by the RSI climbing to its highest reading since the start of the year.
| Change in | Longs | Shorts | OI |
| Daily | -10% | 7% | -5% |
| Weekly | -26% | 66% | -8% |
That said, AUD/USD bullish continuation seems likely until coronavirus recession concerns resurface and bring safe-haven currencies, like the USD, back into demand. The broader US Dollar might remain under pressure as AUD/USD climbs or until there is a resurgence in currency volatility.
-- Written by Rich Dvorak, Analyst for DailyFX.com
Connect with @RichDvorakFX on Twitter for real-time market insight


