


USD/CAD Price, News and Analysis:
- USD/CAD sliding towards a fresh six-week low.
- FOMC meeting and oil price the main drivers for the pair.

USD/CAD - Beginning to Look Oversold?
The Canadian dollar continues to gain against the US dollar with the daily chart with the pair falling by over 3 big figures since early last week. The move in the pair mirrors the recent fall in the US dollar with the greenback losing some of its long-term safe-haven bid as risk markets push higher. Volatility in the pair is likely to increase today both pre and post the US Q1 GDP release, which is expected to slump on an annualized basis from 2.1% to -4.0%, and the latest FOMC policy decision and press conference. Click on the highlighted links to access live coverage of both events. For all market moving data and events please see the DailyFX calendar.
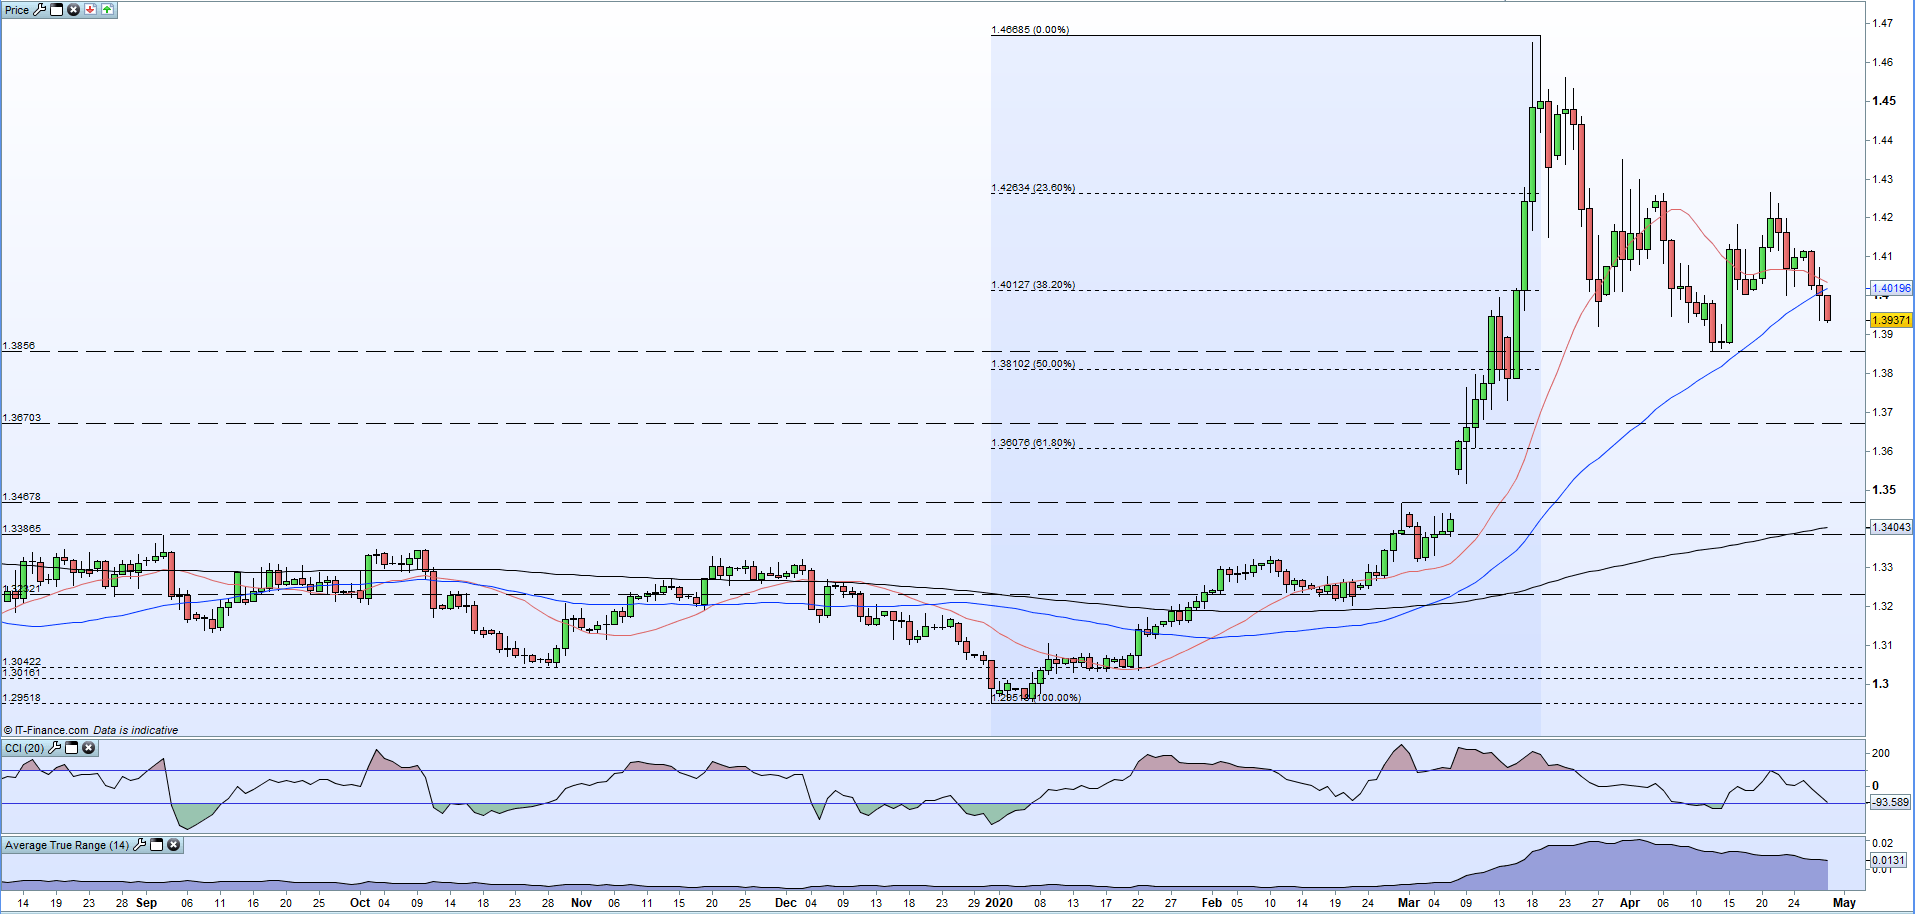
The March 13 swing-low at 1.3858 is within range if the Canadian dollar continues to appreciate against the greenback, followed by the 50% Fibonacci retracement level at 1.38102. USD/CAD will likely need a strong fundamental driver from either of the two events noted above if it is to conclusively break the later level. The CCI indicator is also entering oversold territory for the first time in two weeks.
Today’s sell-off has seen the pair move below both the 20- and 50-day moving averages and open below the 38.2% Fibonacci retracement level at 1.40127. USD/CAD has made seven lower highs in a row, discounting the Sunday candle, weighing down on the pair. The 1.4118 to 1.4124 area may act as a short-term cap to any rebound.
Forex Fundamental Analysis – Data and Central Banks
USD/CAD Daily Price Chart (August 2019 – April 29, 2020)
| Change in | Longs | Shorts | OI |
| Daily | -2% | 7% | 5% |
| Weekly | -30% | 38% | 13% |
What is your view on USD/CAD – bullish or bearish?? You can let us know via the form at the end of this piece or you can contact the author via Twitter @nickcawley1.


