


Brexit, British Pound (GBP) and FTSE 100 - News, Prices and Analysis:

Brexit Talks Resume, Potential Timetable for UK Ending Coronavirus Lockdown
Volatility in the UK asset markets may take a turn higher this week as trade talks resume between the UK and the EU. Last week the UK negotiator David Frost said that there would be no extension of the Brexit transition period – December 31 2020 – even if the EU request one, leaving little changed in the gridlocked relationship between the two. If no progress is made at this week’s meeting, UK assets will likely come under pressure again, leaving their recent gains at risk.
The UK government is also said to be looking at a timetable to reopen the country from the coronavirus lockdown. Early May has been mentioned for the first stage of the process if certain criteria are met with the UK government keen to get the economy re-booted as soon as possible.
The FTSE 100 is currently stalling around 5,800 after having regained around 35% of the January 20 – March 22 sharp sell-off. Technical resistance is seen at 5,883 (50-dma), ahead of 38.2% Fibonacci retracement at 5,889 and the recent one-month high at 5,948. Short-term support is seen at 5,524.
FTSE 100 Daily Price Chart (July 2019 – April 20, 2020)

| Change in | Longs | Shorts | OI |
| Daily | 3% | -7% | -3% |
| Weekly | 4% | -10% | -5% |
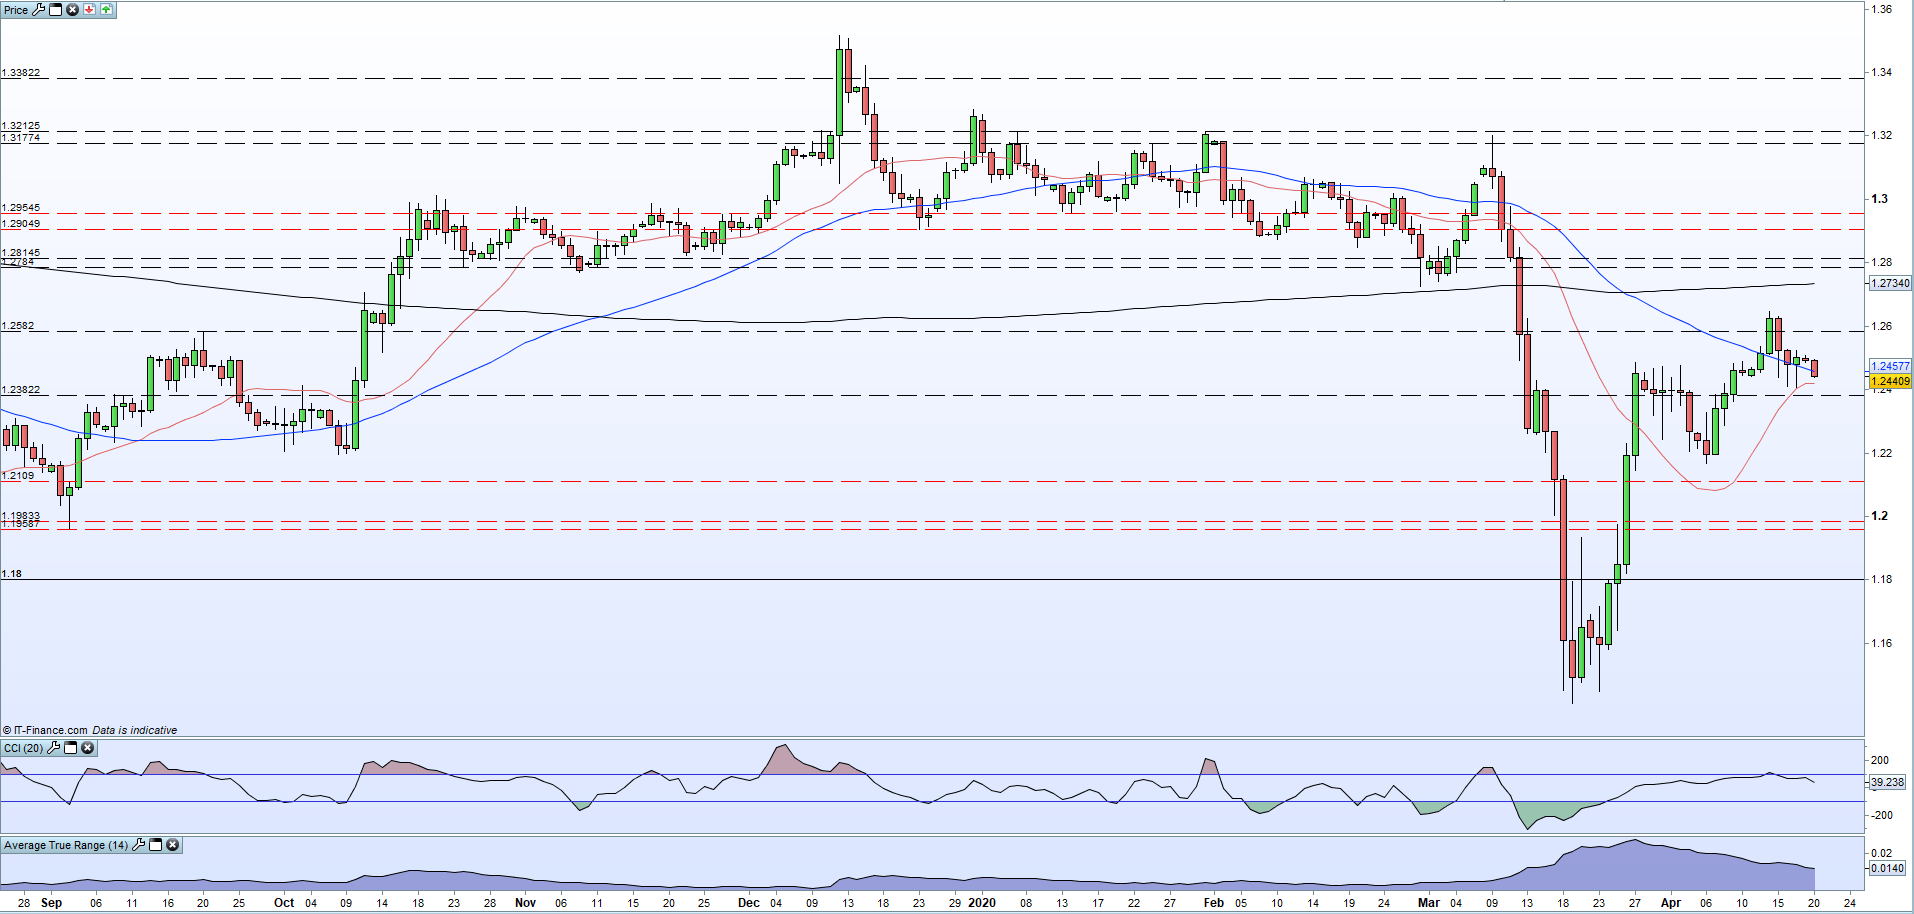
The short-term series of lower highs on the GBP/USD daily chart suggest the pair may continue to move lower with an area between 1.2405 and 1.2420 the first zone of support ahead of 1.2360. The pair may struggle to break 1.2648 if bullish sentiment returns.
GBP/USD Daily Price Chart (August 2019 – April 20, 2020)
Traders may be interested in two of our trading guides – Traits of Successful Traders and Top Trading Lessons – while technical analysts are likely to be interested in our latest Elliott Wave Guide.
What is your view on Sterling (GBP) and the FTSE 100 – bullish or bearish?? You can let us know via the form at the end of this piece or you can contact the author via Twitter @nickcawley1.


