


Crude Oil Price Forecast:
- Coronavirus fears helped spark drastic stock market and crude oil declines
- A critical break beneath support has opened the door for further losses
- Looking ahead, the price of crude may be dependent on an upcoming OPEC meeting
Crude Oil Price Outlook: Commodity Falls Deeper into Bear Market
Crude oil plunged into bear market territory this week as the commodity extended losses beneath support around $50. Falling roughly -35% since its recent high in early January, the growth-linked resource has had its demand outlook pummeled by a global slowdown in shipping, air travel and general economic activity amid the coronavirus outbreak. With economies stumbling and coronavirus cases rising, the outlook for crude remains bleak in the days ahead.
One opportunity for near-term recovery is an upcoming OPEC meeting in which the group may look to reduce production, effectively capping supply in an effort to raise prices. That being said, some members – particularly Russia – have expressed a desire to keep production constant as they see little need to crimp output beyond what the members previously agreed to. While traders await news from the conference, crude will attempt to regain its footing alongside the Dow Jones and other risk assets.
Crude Oil Price Chart: Daily Time Frame (June 2016 – February 2020)
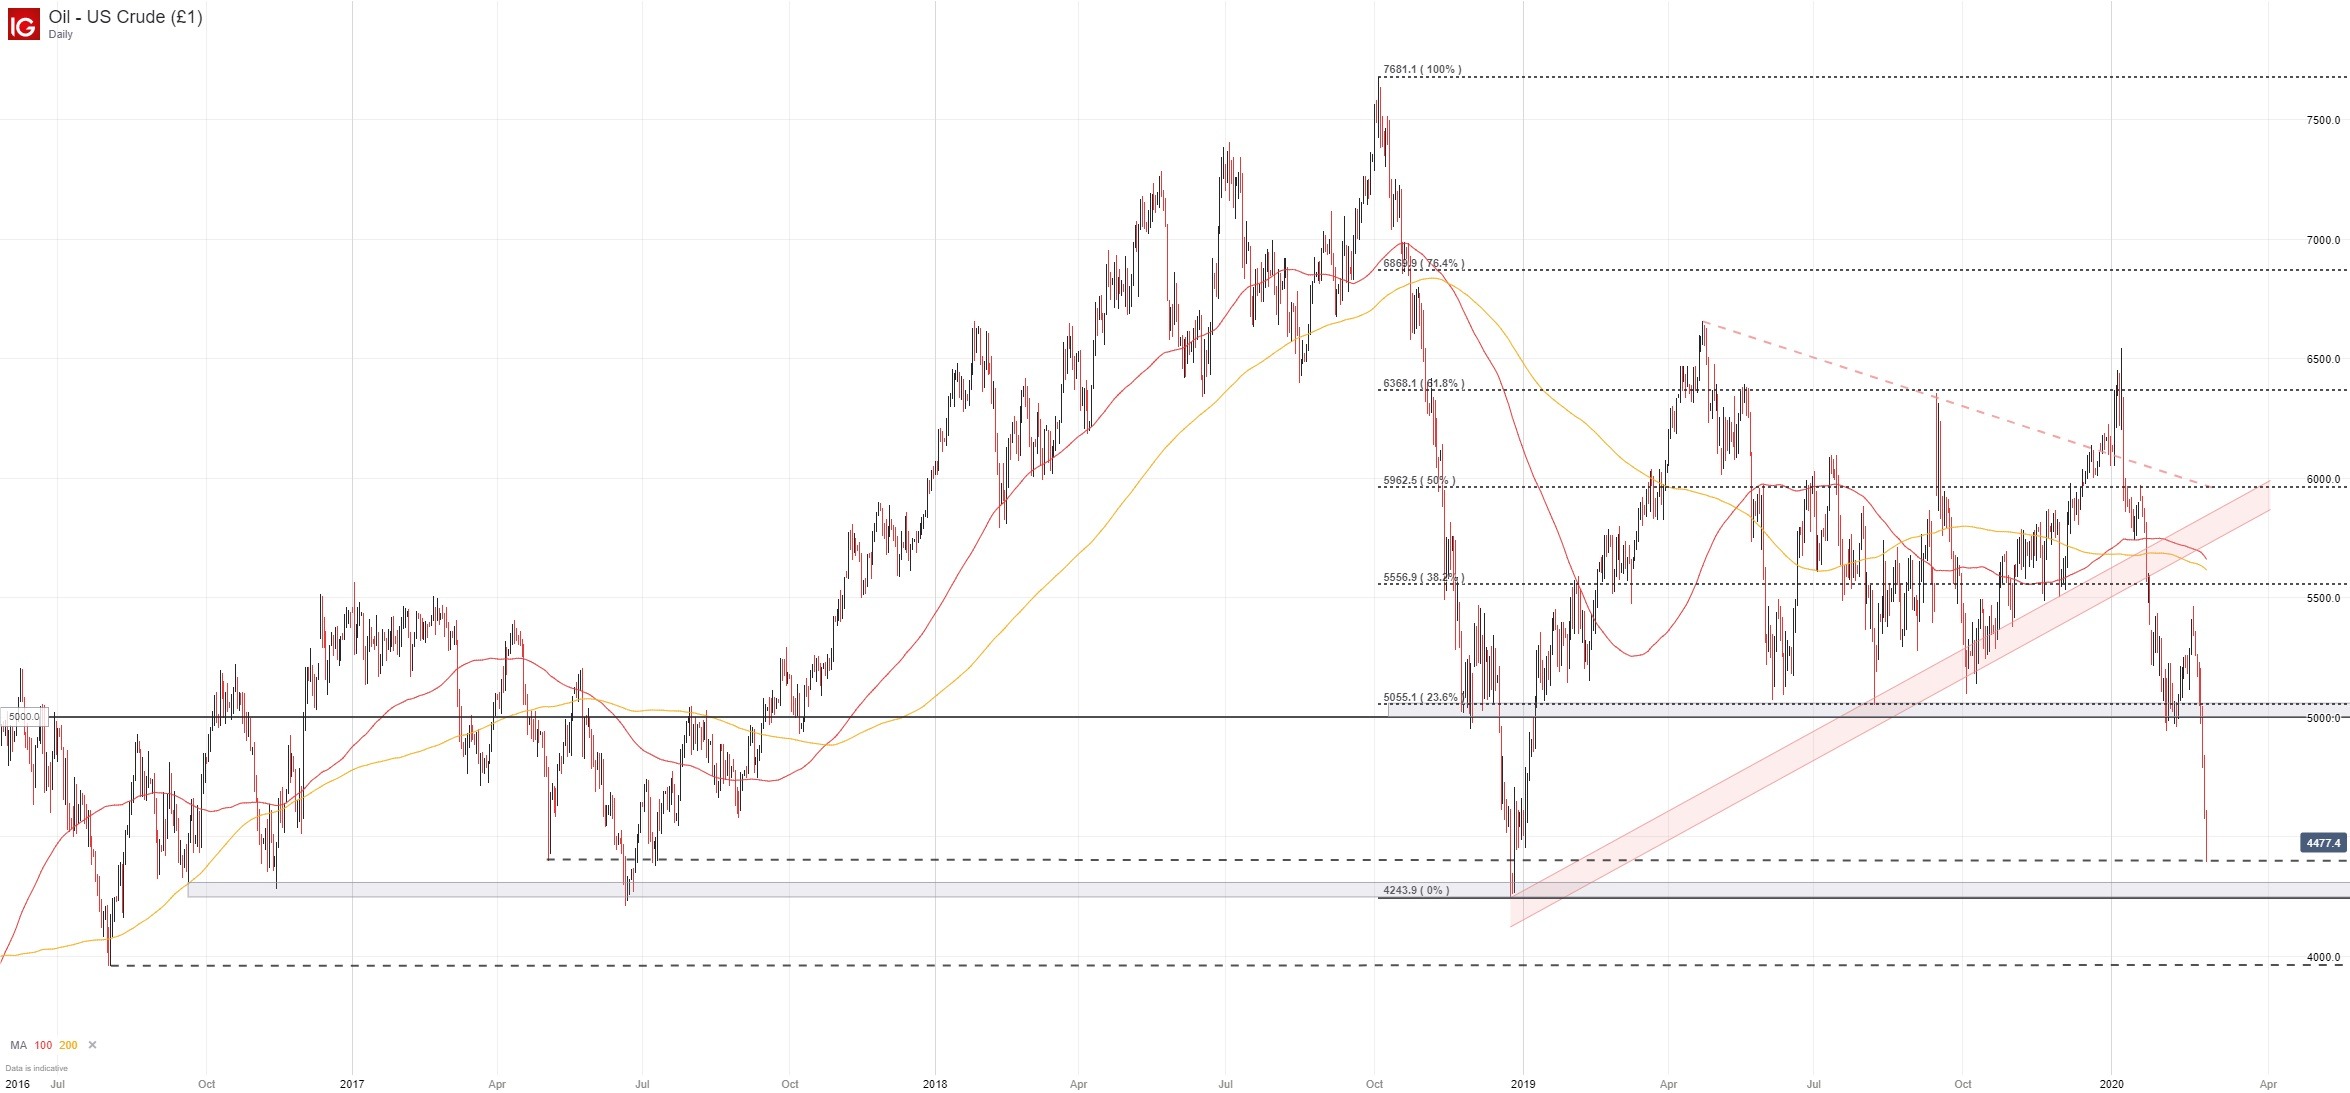
In pursuit of a bottom, chartists will look to nearby support for assistance in keeping price afloat. To that end, the next major level may reside around the December 2018 low, ranging from $43.08 to $42.44. Beyond that, chart analysis will have to extend to 2016 levels and beyond where subsequent support can be outlined around the $40 level and the August 2016 low at $39.58. As crude searches for a bottom, follow @PeterHanksFX on Twitter for updates and analysis.

--Written by Peter Hanks, Junior Analyst for DailyFX.com
Contact and follow Peter on Twitter @PeterHanksFX


