


DAX 30 & FTSE 100 Outlooks:
- The DAX 30 claimed new territory on Wednesday after it breached a longstanding trendline
- On the other hand, the FTSE 100 remains ensnared in its trading range originating in February 2019
- Despite recent bullishness, IG Client Sentiment Data reveals retail traders are overwhelmingly bearish
DAX 30 Forecast
The DAX 30 climbed to a new all-time high on Wednesday despite weak Eurozone and German manufacturing data. The bullish response from the German equity index in the face of weak economic data suggests investors may be expecting further monetary easing from the European Central Bank, a theme that could also be evidenced by Euro weakness which has been pronounced as of late. Whatever the case may be, traders have decided the fundamental landscape is accommodative enough to constitute record valuations for the DAX.
DAX 30 Price Chart: Daily Time Frame (November 2018 – February 2020)
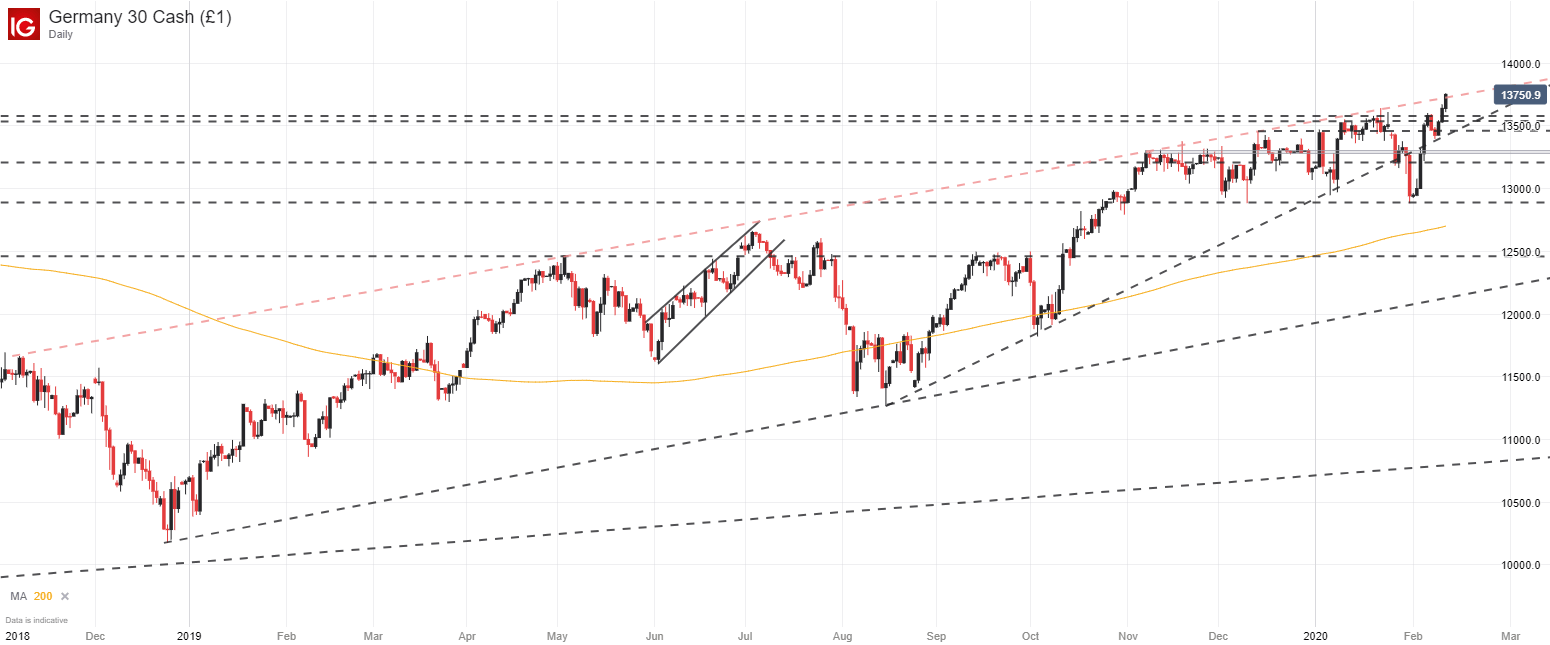
In its surge higher, the index pierced a longstanding trendline that dates to November 2018 that has helped spark numerous reversals lower. Therefore, a confident break above the level and the series of technical barriers around 13,600 is an encouraging technical sign for the index and could allow the DAX to continue higher in the days to come. Further still, the collection of horizontal trendlines beneath will look to buoy price if bearishness takes hold.
| Change in | Longs | Shorts | OI |
| Daily | -9% | 7% | 2% |
| Weekly | -27% | 9% | -5% |
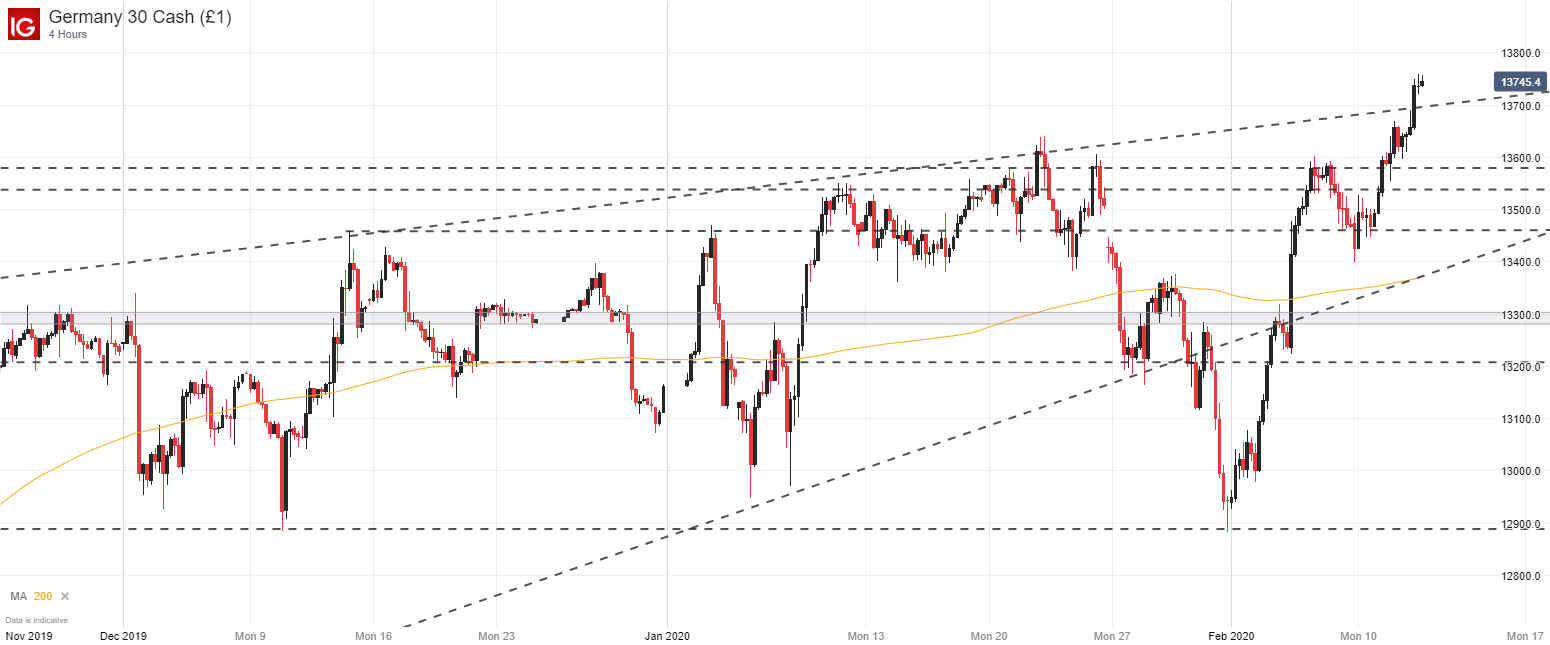
DAX 30 Price Chart: 4 – Hour Time Frame (November 2019 – February 2020)
FTSE 100 Forecast
While the DAX, Dow Jones, S&P 500 and Nasdaq have pressed to new heights, months of Brexit uncertainty has kept the FTSE 100 contained. Now that the divorce has been finalized, it may allow the FTSE to continue higher along an ascending trendline that has helped to buoy price numerous times since August. Residing around 7,340, the level will soon join forces with the 200-day moving average and nearby Fibonacci level around 7,380 which could provide a formidable area of support moving forward.
FTSE 100 Price Chart: Daily Time Frame (May 2019 – February 2020)
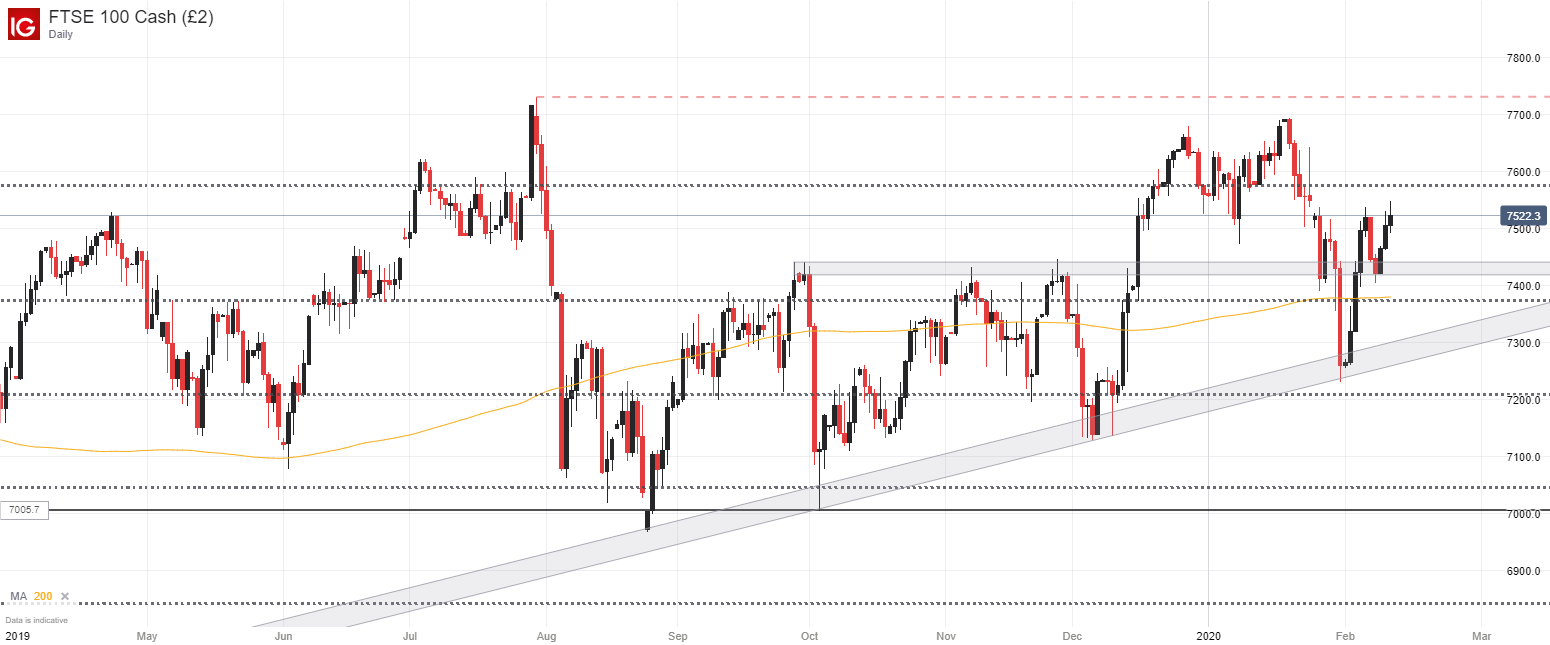
On the other hand, barriers to a continuation higher should reside around 7,580, 7,700 and the July 2019 peak at 7,730. Together, these three levels will look to stall further FTSE gains in the days to come. In the meantime, follow @PeterHanksFX on Twitter for updates and analysis.
--Written by Peter Hanks, Junior Analyst for DailyFX.com
Contact and follow Peter on Twitter @PeterHanksFX


