


BITCOIN FORECAST, BTC/USD ANALYSIS – TALKING POINTS
- BTC/USD may be at bearish turning point as it stalls at critical price juncture
- Bitcoin is up 30% YTD, but it may retrace gains if it breaks below key support
- Bullish breakout may ensue if BTC/USD is able to shatter multi-tiered ceiling
BITCOIN PRICE CHART
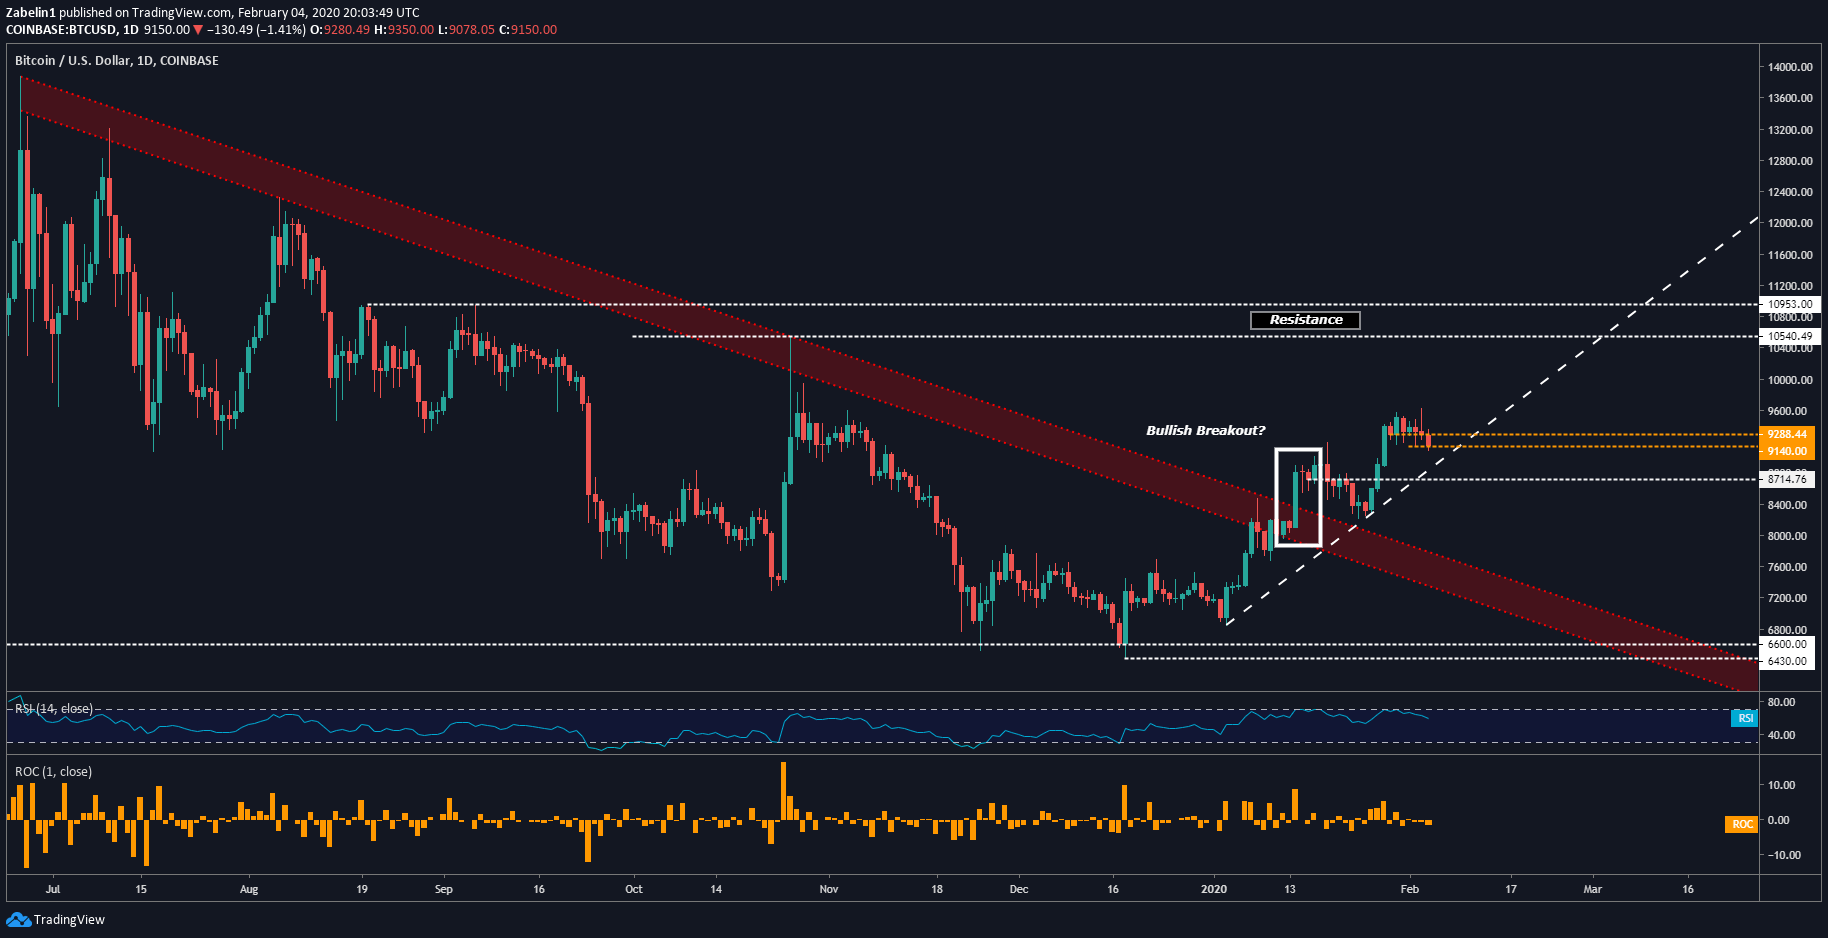
BTC/USD has been on a steady uptrend since early January after it broke through the June 2019 descending resistance channel and climbed over 30 percent in less than a month. However, recent price action suggests the pair’s rise is tapering out as it trades between 9140.0 and 9288.44 (gold-dotted lines) and is slowly approaching the month-long incline.
A downside breakout below the multi-layered floors could catalyze an aggressive selloff if traders believe it signals a broader pullback after its impressive rally. If the pair retreat, selling pressure may abate around 8714.76 (white-dotted line labelled as “support”), a familiar stalling point BTC/USD encountered in the middle of January before it was decisively broken.
Bitcoin – Daily Chart

BTC/USD chart created using TradingView
Zooming out on the daily chart shows a critical resistance range between 10540.49 and 10953.00. Crossing that threshold with a daily close could catalyze a bullish spike if it inspires further follow-through towards critical resistance. This level may be a pivotal moment to watch since capitulation could precede an aggressive selloff whereas a break above that could reinforce upside momentum if it rekindles hope for BTC’s prospects.
Bitcoin – Daily Chart
BTC/USD chart created using TradingView
BITCOIN TRADING RESOURCES
- Tune into Dimitri Zabelin’s webinar outlining geopolitical risks affecting markets in the week ahead !
- New to trading? See our free trading guides here !
- Get more trading resources by DailyFX !
--- Written by Dimitri Zabelin, Jr Currency Analyst for DailyFX.com
To contact Dimitri, use the comments section below or @ZabelinDimitri on Twitter


