


AUSTRALIAN DOLLAR, CHINA PMI, CORONAVIRUS– TALKING POINTS
- Australian Dollar unphased by China PMI statistics as AUD eyes market risk trends
- Coronavirus sapping market mood and pressuring cycle-sensitive Australian Dollar
- Australian Dollar eyes RBA rate decision and key Asian economic reports next week
CHINA PMI IMPACT ON AUSTRALIAN DOLLAR
The Australian Dollar was relatively unimpressed by the release of Chinese PMI data. Non-manufacturing statistics showed an increase to 54.1, higher than the 53 estimate and the prior print at 53.5. Industrial PMI came in as expected at 50 but slightly lower than the previous 50.2 reading. Composite PMI came in at 53, slightly weaker than the previous 53.4 report. Muted reaction in the AUD suggests it is focused on key fundamental risks in the week ahead and other market-wide threats trends that are currently gripping investors.
AUD/USD – 15-Minute Chart
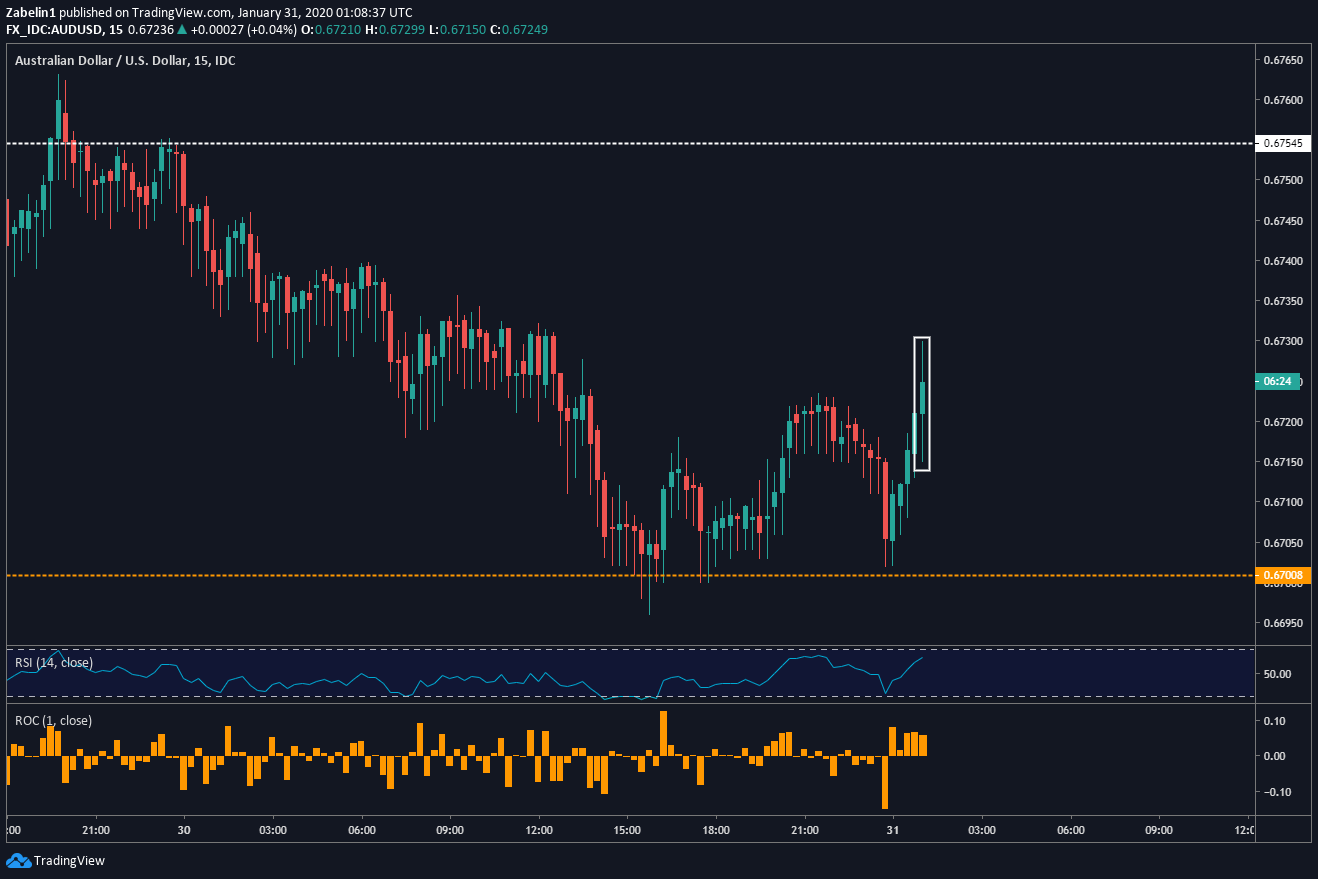
AUD/USD chart created using TradingView
In 2019, the Reserve Bank of Australia (RBA) slashed interest rates three times to a record low at 0.75 percent. Officials repeatedly re-iterated that they are closely watching the labor market and other fundamental themes impacting global growth like the US-China trade war. Earlier this month, trimmed mean CPI – the central bank’s favorite inflation gauge – ticked up to 1.6 percent for Q4, unchanged from the prior period but still below the 2 percent target.
Chinese economic growth has been slowing, though GDP, industrial and retail sales data this month have shown signs of stabilization. The trade war détente between Washington and Beijing has helped to alleviate anxiety about near-term instability in global trade policies. However, growing concern about the coronavirus outbreak and its impact on Asia’s growth prospects sent a regional chill across APAC equities markets.
Looking ahead, traders will be anxiously waiting for the upcoming RBA rate decision next week. According to cash rate futures, expectations of an RBA rate cut next week are fairly low. However, anticipation of a cut in March is not far off from 50%. It also comes during a time when a cascade of key growth data out of Asia – the primary export destination of Australia’s cross-border sales – will also be published.
AUD/USD TECHNICAL ANALYSIS
AUD/USD is now trading below the December 2018 descending resistance channel after briefly breaking out in mid-December 2019. On its way down, the pair shattered support at 0.6754 (white-dotted line) and is now flirting with the October floor at 0.6700. Breaking below that could catalyze further losses while a bounce back opens the door to re-testing former support at 0.6754.
AUD/USD – Daily Chart

AUD/USD chart created using TradingView
AUSTRALIAN DOLLAR TRADING RESOURCES
- Tune into Dimitri Zabelin’s webinar outlining geopolitical risks affecting markets in the week ahead !
- New to trading? See our free trading guides here !
- Get more trading resources by DailyFX !
--- Written by Dimitri Zabelin, Jr Currency Analyst for DailyFX.com
To contact Dimitri, use the comments section below or @ZabelinDimitri on Twitter


