


Nasdaq 100, S&P 500 Outlooks:
- The Nasdaq 100 gapped lower on Monday morning as coronavirus fears sparked risk aversion
- Similarly, the S&P 500 suffered its largest gap lower since May 13
- Will risk aversion continue or will the upcoming Federal Open Market Committee meeting squash volatility?
Nasdaq 100, S&P 500 Forecasts: Will the Tumble Continue?
The Nasdaq 100 and S&P 500 opened significantly lower on Monday on the back of coronavirus fears as the VIX jumped to its highest level since early October. In turn, haven assets like gold and the US Dollar were materially higher. Since the exact threat the virus poses to both populations and economic productivity is still unknown, the market will likely continue to wrestle with the theme in the days ahead. That being said, investors may shift their immediate focus to the upcoming FOMC meeting on Wednesday which could help stall further volatility for the time being.
Nasdaq 100 Outlook
Given the significance of the Fed’s policy path, specifically the expansion of the balance sheet, some traders may be hesitant to commit to a direction ahead of an event that could potentially uproot the current fundamental backdrop in the United States. Similarly, earnings from AMD and Apple on Tuesday afternoon may morph the role of coronavirus as a headlines concern if the companies forecast an adverse impact on revenue.
Nasdaq 100 Price Chart: 4 - Hour Time Frame (November 2019 – January 2020)
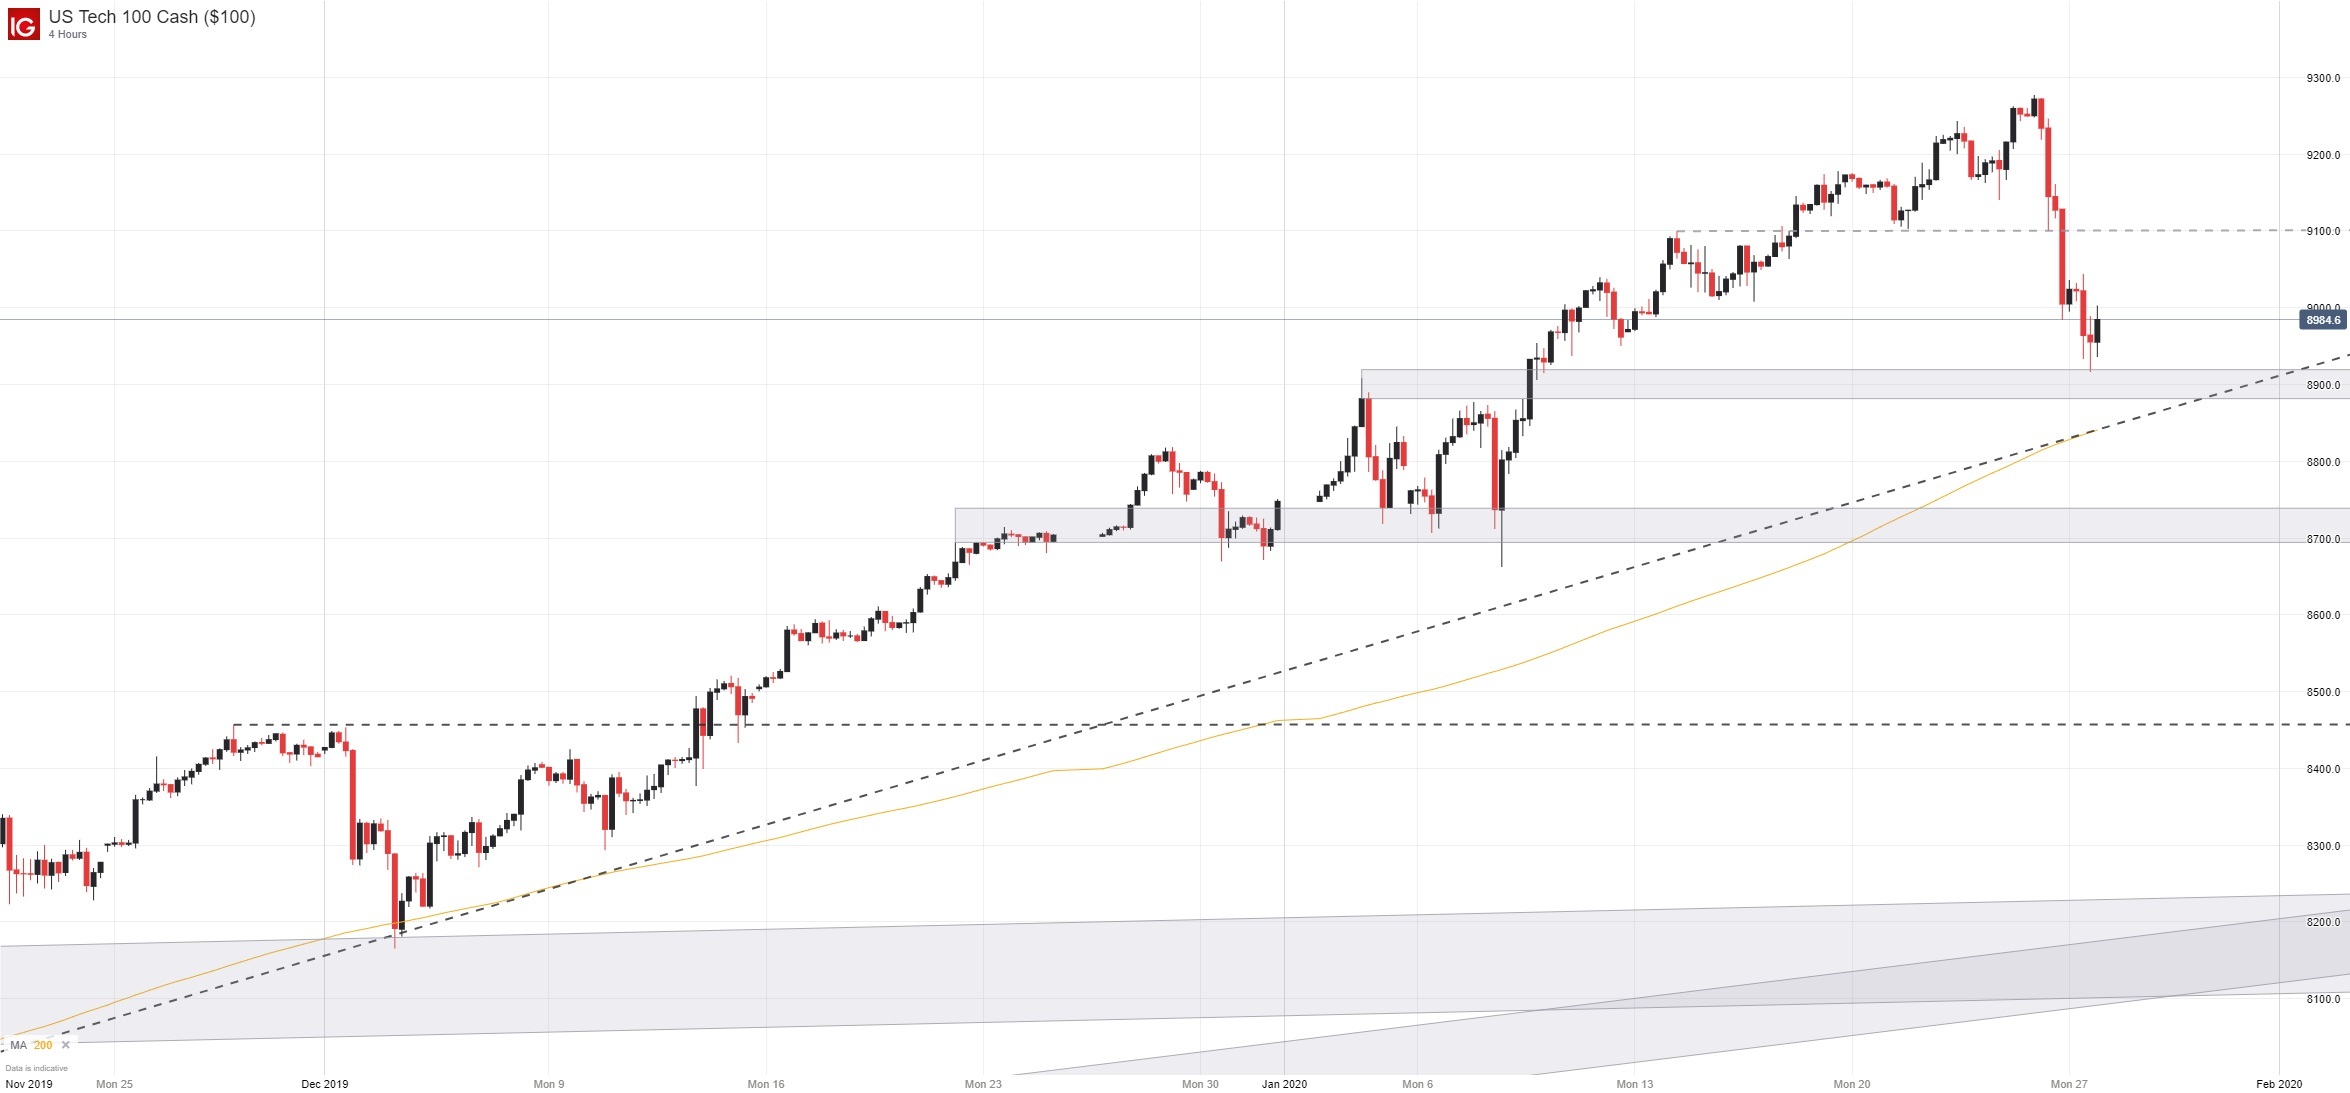
In the meantime, the Nasdaq 100 will look to hold above the ascending trendline from early October and the 200-period moving average around 8,900. A break beneath the zone would allow the tech-heavy index to probe lower lows, with possible support around 8,740 to 8,700. For earnings insight and analysis follow @PeterHanksFX on Twitter.
S&P 500 Outlook
While Apple possesses less influence over the S&P 500 than it does the Nasdaq 100, it is still the index’s largest component. Therefore, any transitory risk from the coronavirus cited in Apple’s outlook could seriously dent sentiment and the S&P 500. Tracking the ascending trendline from October, the S&P 500 has less space to work with from a technical perspective than the Nasdaq, so a disappointing report could easily drive the index beneath the area of confluent support.
S&P 500 Price Chart: 4 - Hour Time Frame (October 2019 – January 2020)

While traders may prefer the relative clarity following a FOMC rate decision, the uptick in volatility and uncertainty has left the two indices vulnerable ahead of the meeting. A further breakdown in risk appetite could see the S&P 500 test support at the January low of 3,180 before retreating further to the 3,150 area and the passing of the FOMC meeting could allow for greater follow-through. With that in mind, it appears the equity market has two critical tests ahead of it in the days ahead.

--Written by Peter Hanks, Junior Analyst for DailyFX.com
Contact and follow Peter on Twitter @PeterHanksFX


