Crude Oil (CLUSD) Price, Analysis and Charts:
- Crude oil sell-off yet to find strong support.
- Oil demand roiled by coronavirus outbreak.
Oil Price (CLUSD) Searching for Support as Sellers Dominate
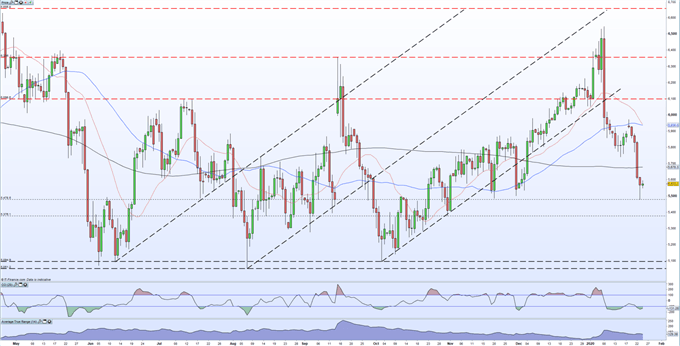
The price of crude oil has fallen over 16%, high-to-low, since the $65.48/bbl. high print on January 8 with the price collapsing through trend support and all three moving averages. Last week’s strong surge in supply was partially offset by this week’s reduced supply but demand may soon be hit lower as the coronavirus outbreak continues. Ten cities in China are now in lockdown, restricting the movement of over 33 million people, while flights have been suspended to contain the deadly virus. This is weighing on oil with aviation fuel demand expected to fall, while Chinese economic activity will also be hit by the lockdowns. China recently said that the number of virus-related has risen to 25, while over 800 people have been infected.
Crude oil touched a near three-month in Thursday’s sell-off, having conclusively broken through the 200-dma the day before. The next level of support comes off an old higher low at $53.86/bbl. and this may hold especially as the CCI indicator shows the market in oversold territory. Below here, a cluster of minor higher lows before stronger support between $50.50/bbl. and $51.00/bbl. comes into view. This level has held for over one year. The current price, $55.70/bbl. is also just above the 38.2% Fibonacci retracement ($55.56/bbl.) of the 3 Oct 2018 high ($76.81/bbl.) to December 2018 low ($42.44/bbl.) slump and again may prove supportive.


For a full rundown of all market moving economic data and events see the DailyFX Calendar
Crude Oil Daily Price Chart (May 2019 - January 24, 2020)


Traders may be interested in two of our trading guides – Traits of Successful Traders and Top Trading Lessons – while technical analysts are likely to be interested in our latest Elliott Wave Guide.
What is your view on Oil – bullish or bearish?? You can let us know via the form at the end of this piece or you can contact the author via Twitter @nickcawley1.


