USD/CNH Price Forecast, Analysis and Chart:
- China will sign phase one of US-China trade deal next week.
- USD/CNH may be allowed to slip lower.


USD/CNH Downtrend Continues to Multi-Month Lows
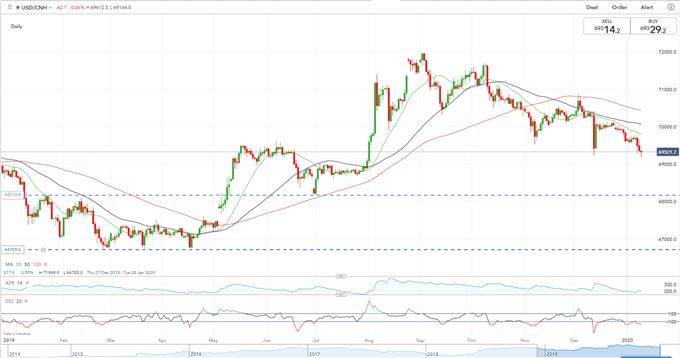
USD/CNH made a fresh 5-month low today around 6.9180 as Chinese Yuan buyers drove the pair lower. Market talk is that the Bank of China is standing back and not actively intervening in propping the Chinese Yuan up ahead of next week’s signing of phase one of the US-China trade deal. A recent article in the South China Morning Postposited that there may be clauses in next week’s deal that prohibit China from manipulating its currency. US President Trump has been very vocal about the effects of the weak Chinese Yuan on the US economy. Chinese Vice Premier Liu will lead the Chinese delegation to the US to sign the deal on January 15.
US-China Trade War & a Brief History of Trade Wars – 1900 until Present
The daily USD/CNH chart shows the defined downtrend in the pair since the early September high just under 7.2000. A series of lower highs and lower lows continue, while USD/CNH is now under all three moving averages, another negative set-up. The chart shows a cluster of old highs and lows between mid-May and mid-June last year that may slow down any further sell-off with the medium-term target for the pair down just below 6.8200. The CCI indicator shows that USD/CNH is currently oversold, although not at the extreme levels seen in mid-December.
For all economic data and events, see the DailyFX Economic Calendar.
USD/CNH Daily Price Chart (January 2019 - January 9, 2020)


Traders may be interested in two of our trading guides – Traits of Successful Traders and Top Trading Lessons – while technical analysts are likely to be interested in our latest Elliott Wave Guide.
What is your view on the US Dollar and Chinese Yuan – bullish or bearish?? You can let us know via the form at the end of this piece or you can contact the author at nicholas.cawley@ig.com or via Twitter @nickcawley1.


