


Canadian Dollar (CAD) Price, Chart and Analysis

USD/CAD Price Unable to Break Bearish Spell
The Canadian dollar remains firm, boosted by the recent surge in oil prices, and is re-testing a 14-month low against the US dollar made just last week. Last week’s break below the mid-July low at 1.3016, and the subsequent close below this level, highlighted the weakness in the pair.
Crude Oil Price Fails to Break Resistance
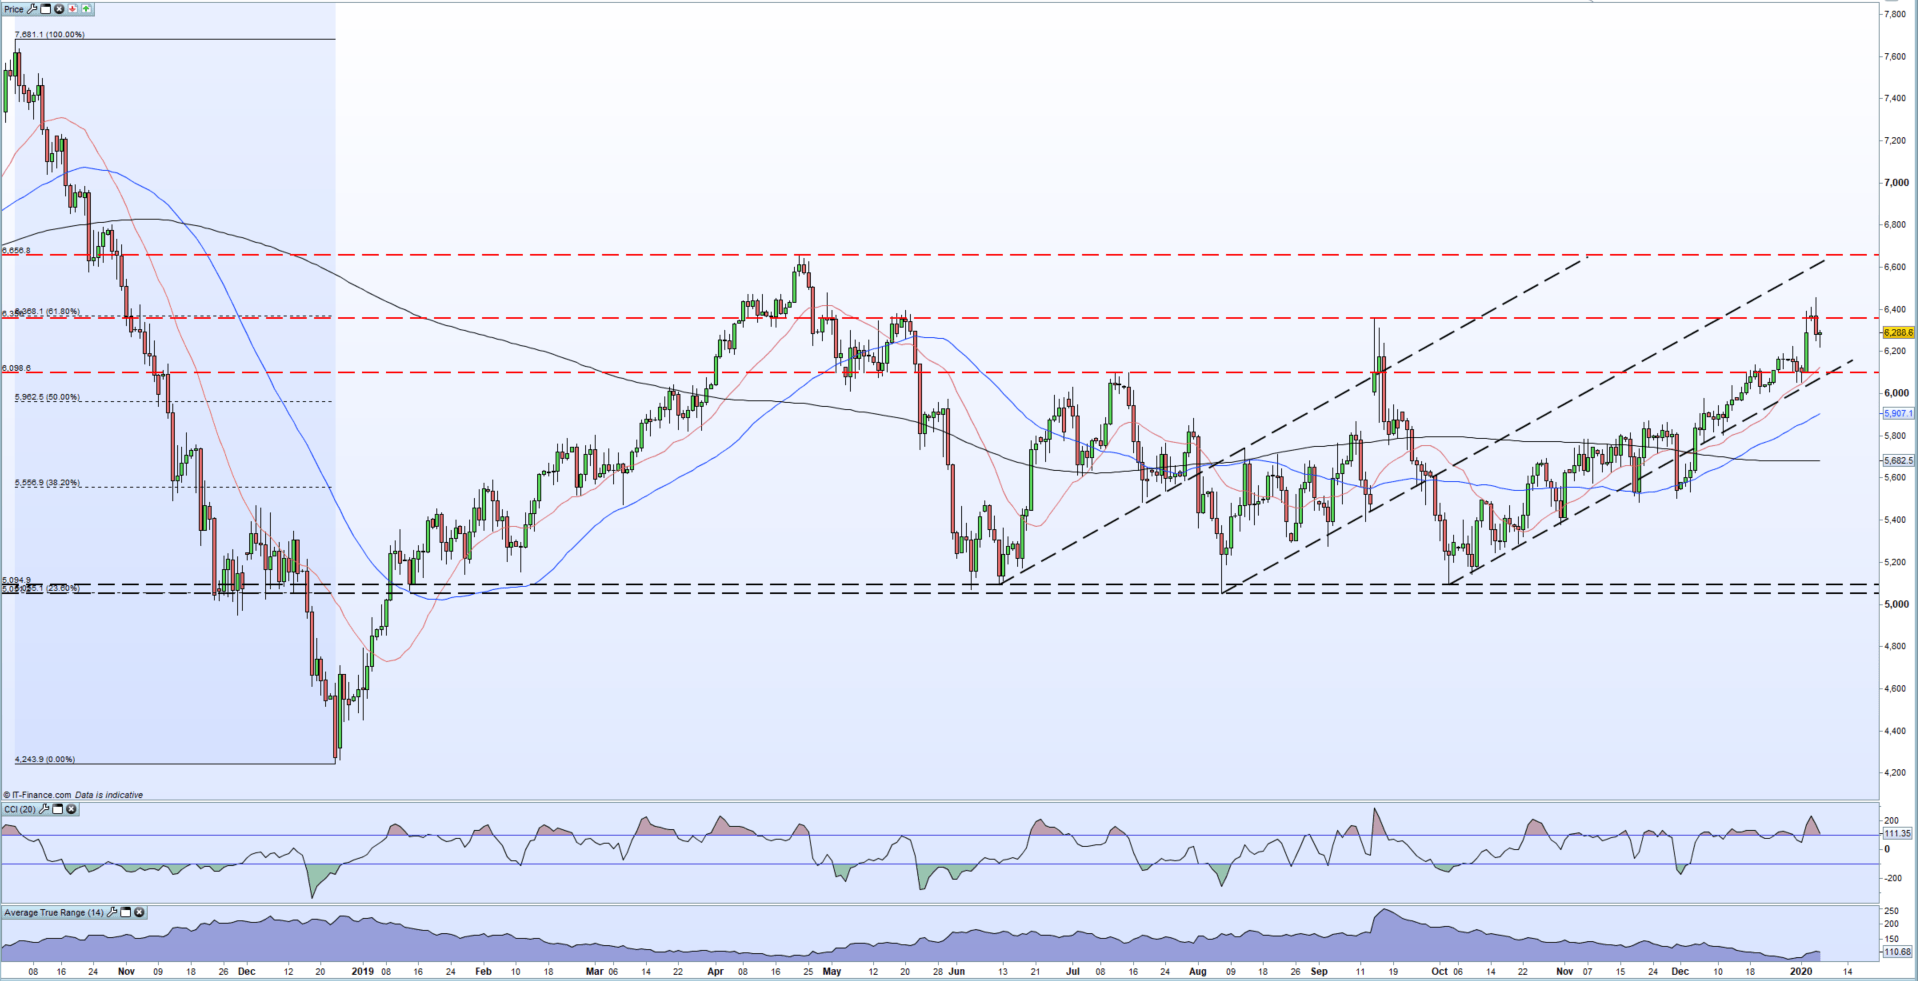
US Crude oil prices are currently trading in a defined bullish channel and have just rejected the 61.8% Fibonacci retracement level at $63.68/bbl. The chart remains positive, buttressed by the recent golden cross formation, although the CCI indicator does show oil in overbought territory.
Oil Price Outlook: Snap Back from Eight-Month Highs, More to Go?
US Crude Oil Daily Price Chart (October 2019 – January 7, 2020)
The sell-off in USD/CAD has accelerated in the last seven weeks, and while the chart set-up remains negative, the CCI indicator suggests that market conditions are oversold at the present which may stem further losses in the near-term.
A break and close below 1.2952 would re-affirm the negative chart set-up and bring into focus horizontal support levels seen in October last year. Initial support around 1.2916 ahead of 1.2883 with swing -low at 1.2782 a possible supportive level.
The latest Canadian jobs numbers are released on Thursday at 13:30 GMT and are expected to show 25k jobs created, while the unemployment rate is expected to fall by 0.15 to 5.8% in December.
For all market moving data releases and events, see the DailyFX calendar.
USD/CAD Daily Price Chart (March 2019 – January 7, 2020)

Traders may be interested in two of our trading guides – Traits of Successful Traders and Top Trading Lessons – while technical analysts are likely to be interested in our latest Elliott Wave Guide.
What is your view on the Canadian Dollar (CAD) – bullish or bearish?? You can let us know via the form at the end of this piece or you can contact the author at nicholas.cawley@ig.com or via Twitter @nickcawley1.


