


Sterling Price (GBP) Analysis and Charts
- GBP/USD bounces off 1.3000 big figure support.
- Markets winding down ahead of the holiday season.

Sterling Gives Back 5 Points in One Week
Bullish Sterling traders have been left in a hole this week as sellers pushed the British Pound back down to pre-election levels. GBP/USD hit 1.3515 post-election but now trades around 500 pips lower with sellers fuelled by fears that the UK may still leave the EU by the end of 2020 with no deal, after Boris Johnson said that he would enshrine in law that there would be no extension to the December 2020 leaving date. While this eventuality is one year away, the market has still reacted sharply to the news, despite PM Johnson also saying that a deal can be struck in time.
Low market turnover and end-of-year positioning will not have helped support GBPUSD, especially with strong demand for the US dollar pushing the greenback higher. The US Federal Reserve this week issued another $500 billion of short-term liquidity - on top of the $350 billion printed since August – to prevent year-end funding problems.
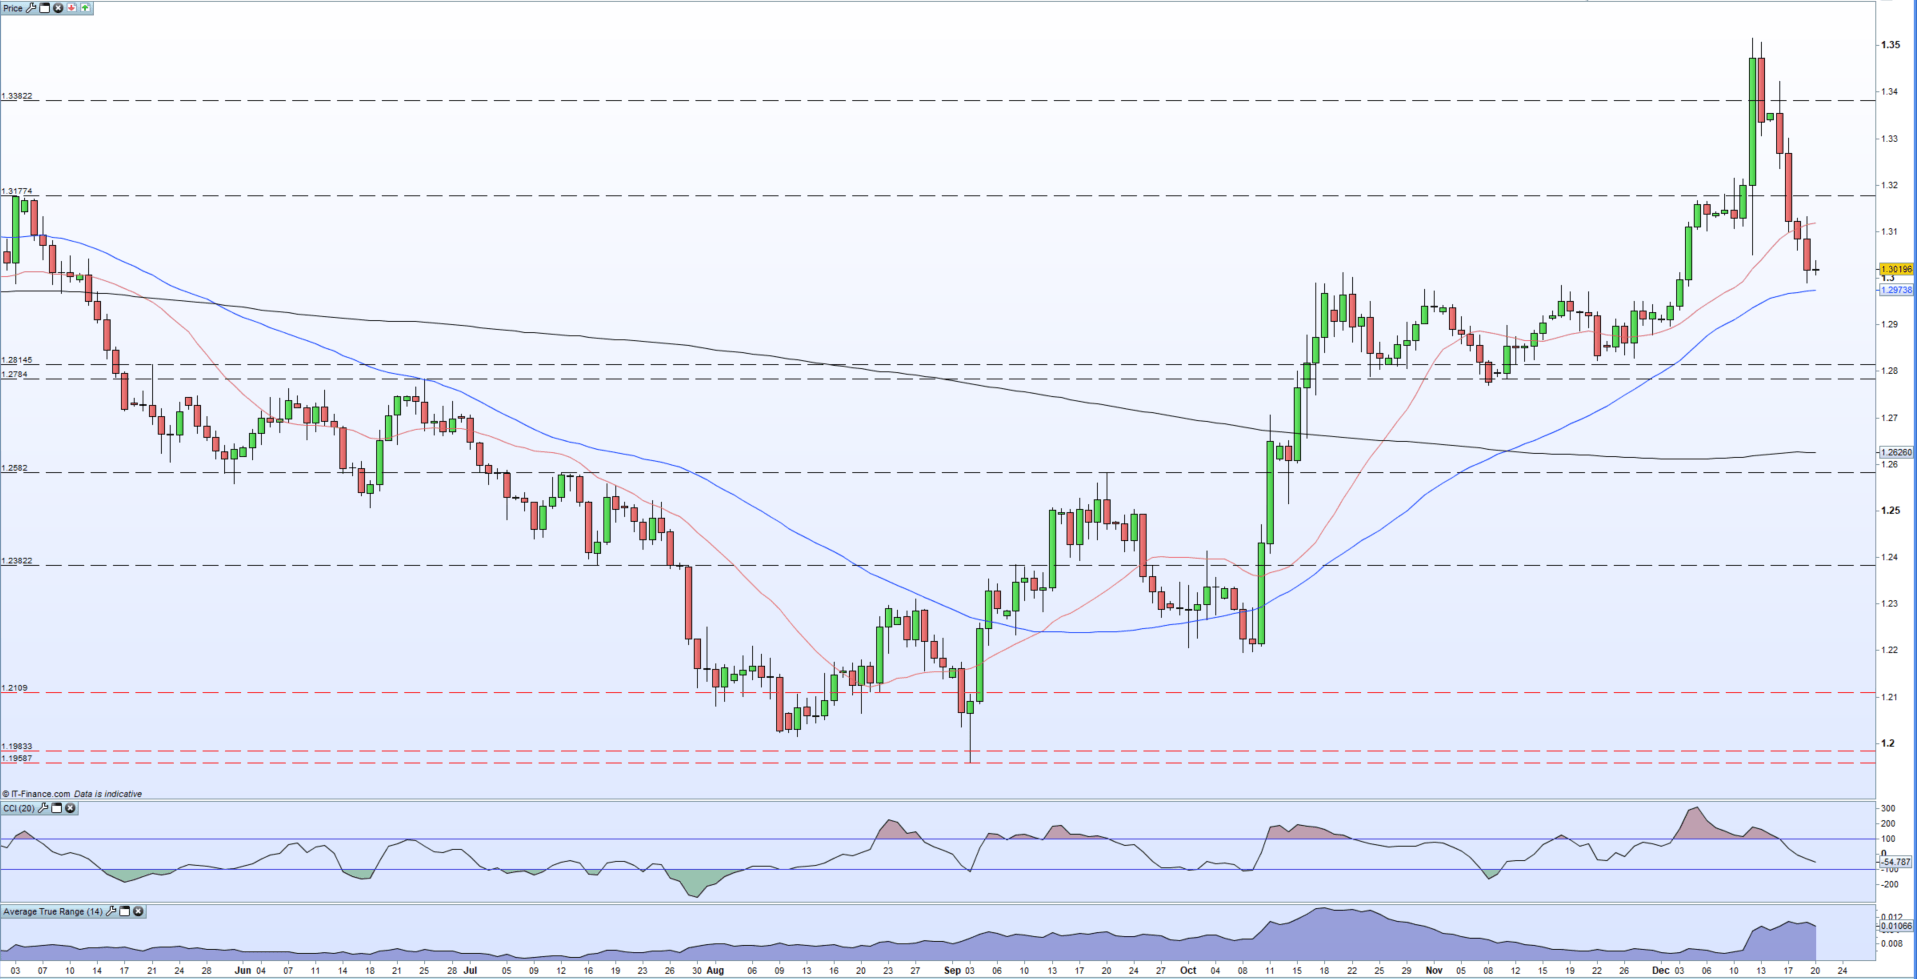
The daily chart shows the original flag break-out was triggered by a break above 1.3015 after the pair’s upside had been capped for the preceding 5-6 weeks. For GBPUSD to push higher this level, and the 1.3000 big figure support will need to hold. GBP/USD did briefly break below 1.3000 on Thursday but pulled back quickly.
There is a packed UK data calendar at 09.30 GMT with GDP and public sector borrowing figures the most notable, although the market moving potential is low, especially in such a quiet market. For all economic data releases and events, see the DailyFX Calendar.
| Change in | Longs | Shorts | OI |
| Daily | -2% | 6% | 1% |
| Weekly | -13% | 30% | 1% |
GBP/USD Daily Price Chart (April – December 20, 2019)
What is your view on Sterling?? You can let us know via the form at the end of this piece or you can contact the author at nicholas.cawley@ig.com or via Twitter @nickcawley1.


