

New Zealand Dollar, Japanese Yen, NZD/JPY – TALKING POINTS
- NZD/JPY technical cues signal upside momentum is waning
- Pair is approaching key resistance at 71.822 – will it hold?
- Bearish correction may be amplified by fundamental risks
Learn how to use politicalrisk analysis in your trading strategy !
NZD/JPY continues to climb above the October uptrend – red parallel channel – though upside momentum appears to be ebbing. If a correction is in the cards, the next possible area of support may be at the 69.897-70.030 zone where selling pressure may be alleviated as buyers may start swooping in.
NZD/JPY – Daily Chart
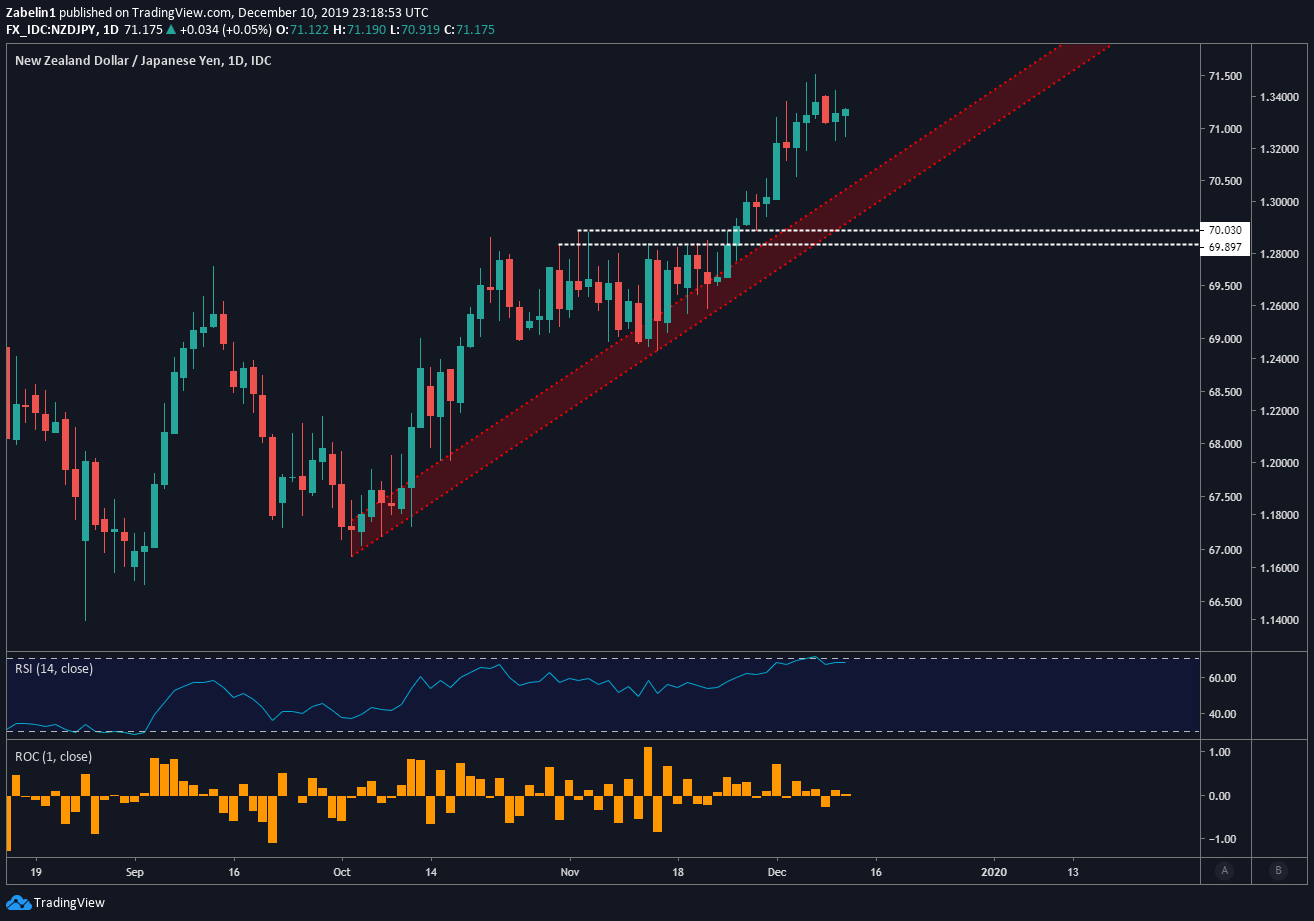
NZD/JPY chart created using TradingView
However, if the pair continues to climb higher, the next major point of resistance may be at 71.822. A break above that could open the door to testing the peak of the July 2019 selloff at 73.245. However, traders may be waiting for critical fundamental developments to evolve before placing their trades. This includes the FOMC rate decision, UK election outcome and the US’ decision on the December 15 tariff hike against China.
NZD/JPY – Daily Chart
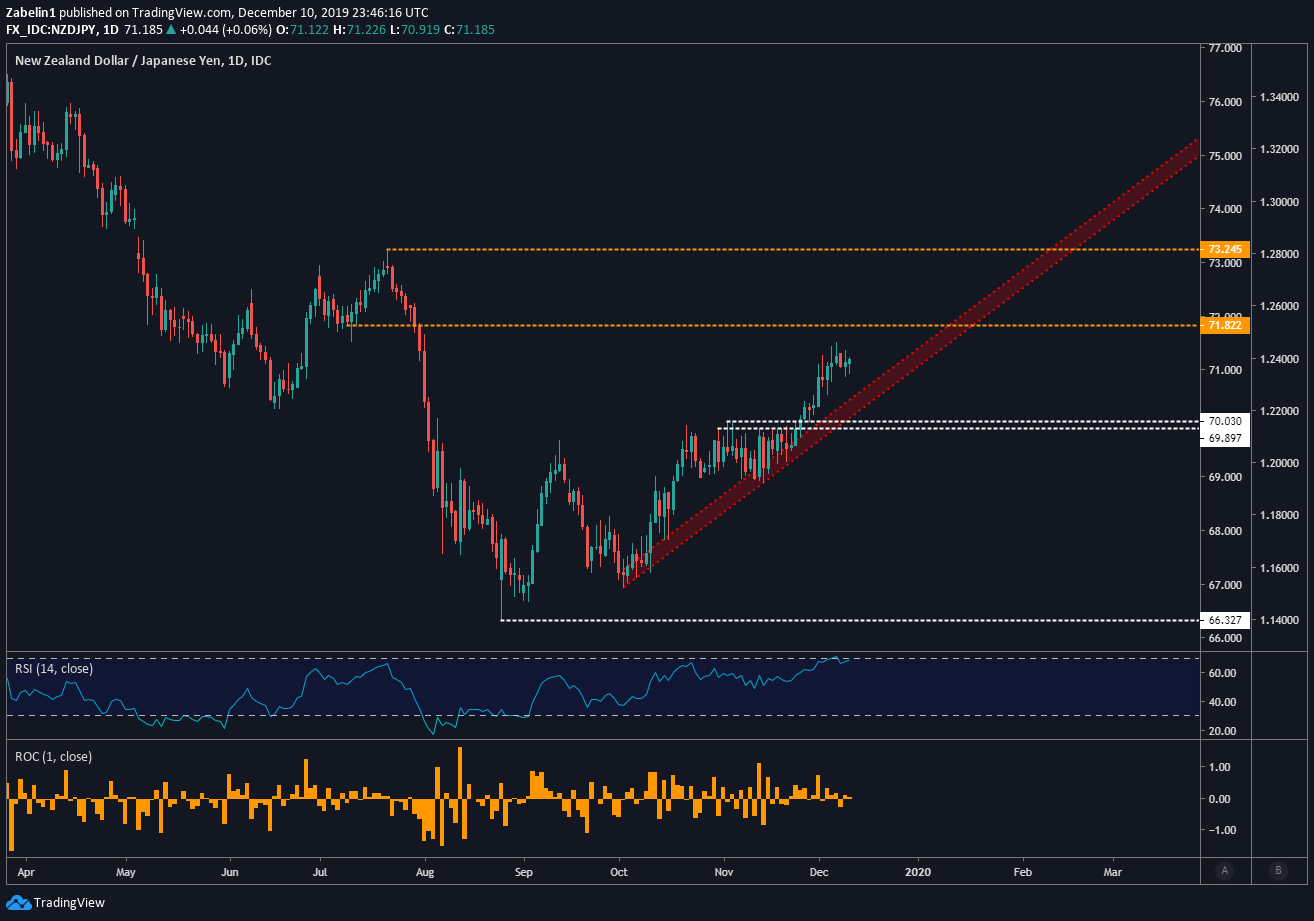
NZD/JPY chart created using TradingView
Zooming out to a weekly chart, however, shows a much gloomier picture. The pair has been trading below a descending resistance channel since January 2015. Recent price action suggests the pair may be attempting to make another attempt at re-testing resistance. Failure to break above the ceiling could result in a selloff as discouraged bulls offset their long positions.
NZD/JPY – Weekly Chart
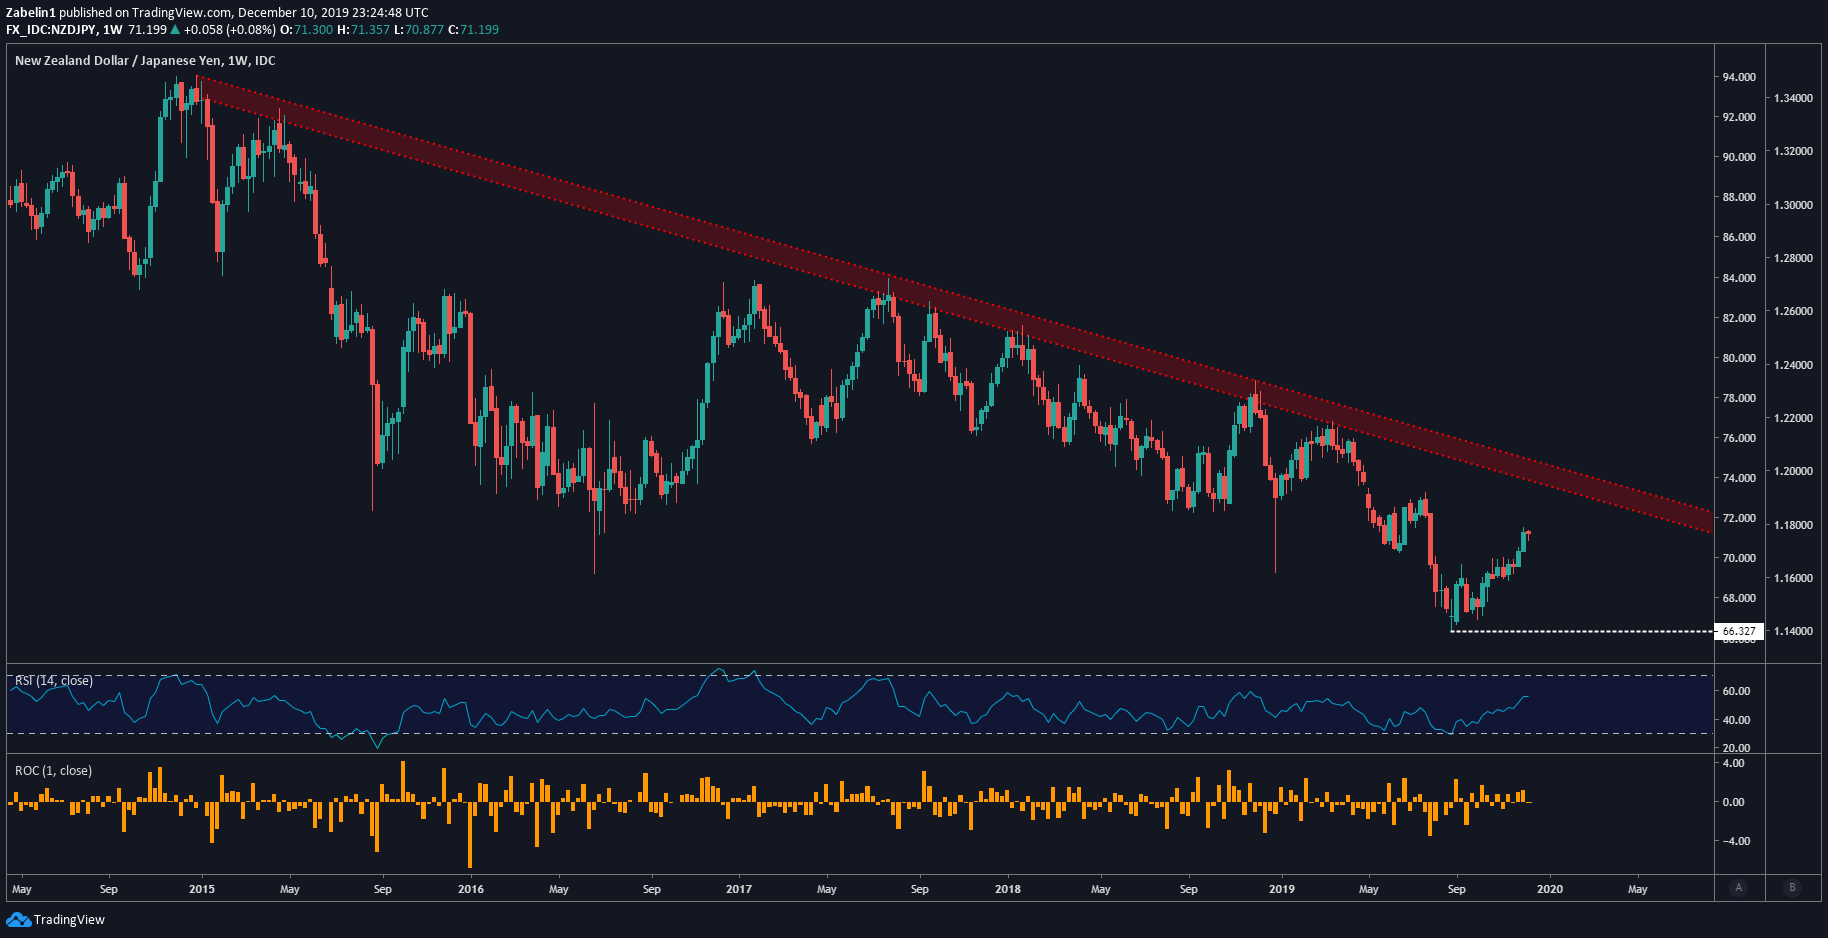
NZD/JPY chart created using TradingView
NZD/JPY TRADING RESOURCES
- Join a free webinar and have your trading questions answered
- Just getting started? See our beginners’ guide for FX traders
- Having trouble with your strategy? Here’s the #1 mistake that traders make
--- Written by Dimitri Zabelin, Jr Currency Analyst for DailyFX.com
To contact Dimitri, use the comments section below or @ZabelinDimitri on Twitter
-