


Crude Oil Analysis & News
- Crude Oil Volatility Surges Amid OPEC Meeting
- Investors Betting on Oil Breakout
Crude Oil Volatility Surges Amid OPEC Meeting
Crude oil volatility is notably elevated as OPEC ministers convene for their bi-annual meeting. Consensus is for the cartel to stick with its current production quota of 1.2mbpd with an extension to June (OPEC cuts set to expire in March 2020). However, given that non-OPEC production looks set to outstrip global oil demand throughout the first half of 2020, risking a supply glut. There has been increased calls for OPEC to opt for deeper production cuts with a touted figure of 400kbpd in order to balance the market. In turn, this has meant that the bar is relatively low for OPEC to disappoint, meaning that by failing to deliver deeper cuts would likely place pressure on oil prices with Brent crude at risk of falling below $60 in the near term. As it stands, according to the CME volatility calculator, Brent crude volatility is at 57%, which signals an implied move of $3.60.

OPEC Schedule
Dec 5th:
- JMMC at 1000GMT
- OPEC Meeting at 1400GMT
Dec 6th:
- OPEC+ Meeting at 1000GMT
Investors Piling into Oil Ahead of OPEC Meeting
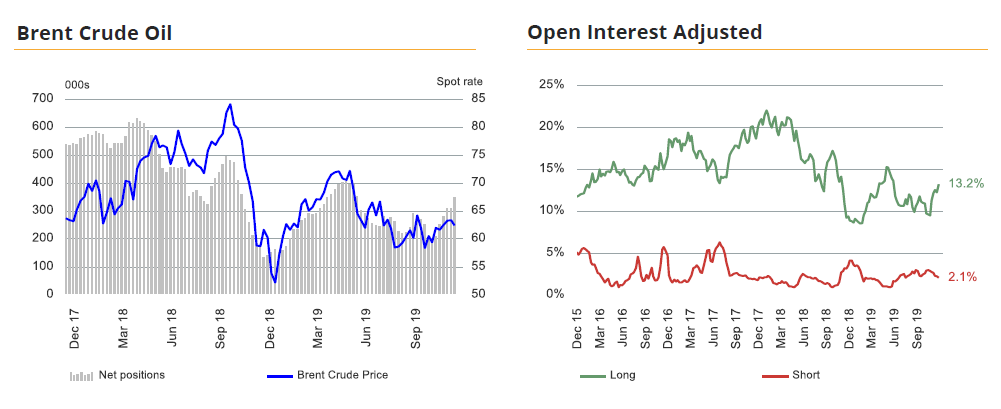
Speculative positioning data via the CFTC highlighted that investors had been piling into Brent crude in recent weeks ahead of the OPEC meeting, in which they now hold the largest bullish bet in crude oil since the end of May. As such, while investors may be betting on a bullish breakout in oil prices, this however, further emphasises that an uninspiring OPEC meeting may spark a notable drop in crude oil as long positions are liquidated.
Crude Oil Price Chart: Daily Time Frame (Jul 2019 – Dec 2019)
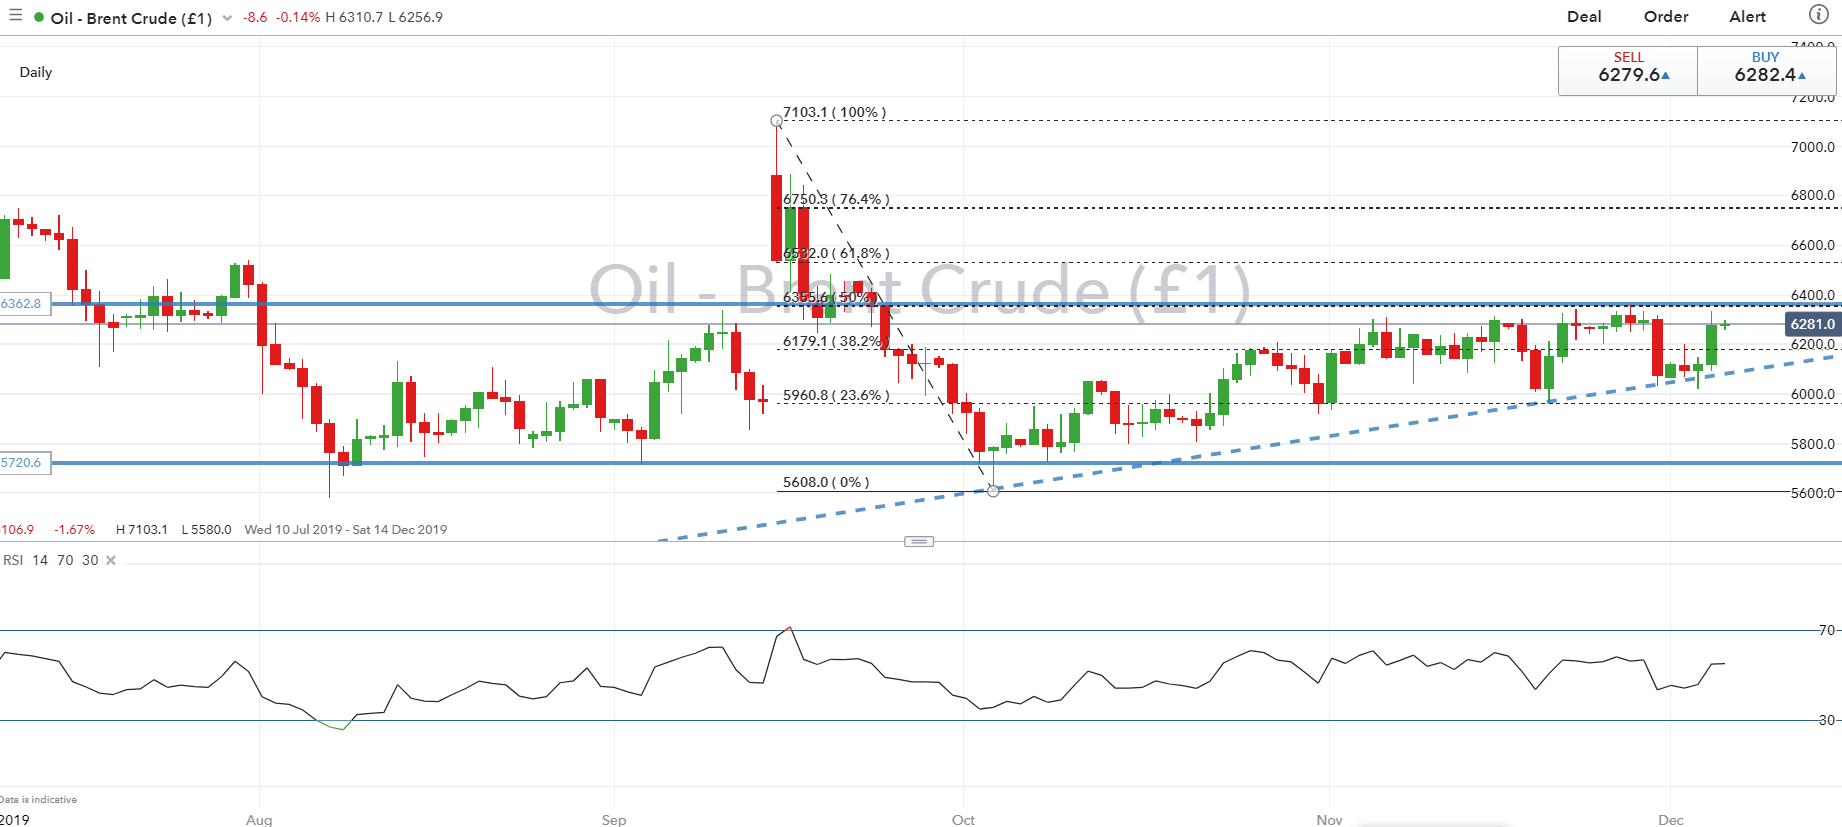
Support: $61.00 (Rising Trendline), $59.60 (23.6% Fib of 7103-5608 drop)
Resistance: $63.60 (November peak), $65.32 (61.8% Fib)
Brent Crude Correlation with FX
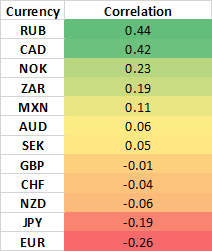
*3-month correlation with Brent crude oil
--- Written by Justin McQueen, Market Analyst
To contact Justin, email him at Justin.mcqueen@ig.com
Follow Justin on Twitter @JMcQueenFX


