


Crude Oil Price Outlook:
- Crude oil prices received a bump last week, approaching $57 a barrel
- Still, demand concerns have flared as global growth shows continued signs of slowing
- That said, crude oil could fall under pressure in the coming days if the Fed is less dovish than anticipated
Crude Oil Price Outlook Looks Bearish at Resistance Ahead of FOMC
Crude oil finds itself at a crossroad as price approaches the 200-day moving average, but fundamentals look to keep the commodity in check. In October, however, OPEC announced it would reduce output in 2020 due to lower demand forecasts – a byproduct of slowing global growth. Consequently, crude oil rallied to trendline resistance around $57 and could look to reclaim the 200-day moving average and continue higher.
That said, Wednesday’s Fed meeting could look to derail the commodity’s rebound. A 25-basis point cut is widely expected, but market participants are less confident in the subsequent forecast. With that in mind, there is potential for the Fed to disappoint the market. Should the central bank signal October’s cut marks the end of a “mid-cycle adjustment,” it could translate to weaker growth forecasts.
With Hong Kong’s economy slipping into recession, weakening retail sales data in the United States and worrisome growth forecasts from various intergovernmental economic bodies, the argument for a global recession has only firmed. Therefore, crude’s demand outlook - and by extension price - could falter in the weeks ahead should the Fed offer a relatively hawkish lean.
Crude Oil Price Chart: Daily Time Frame (January – October) (Chart 1)
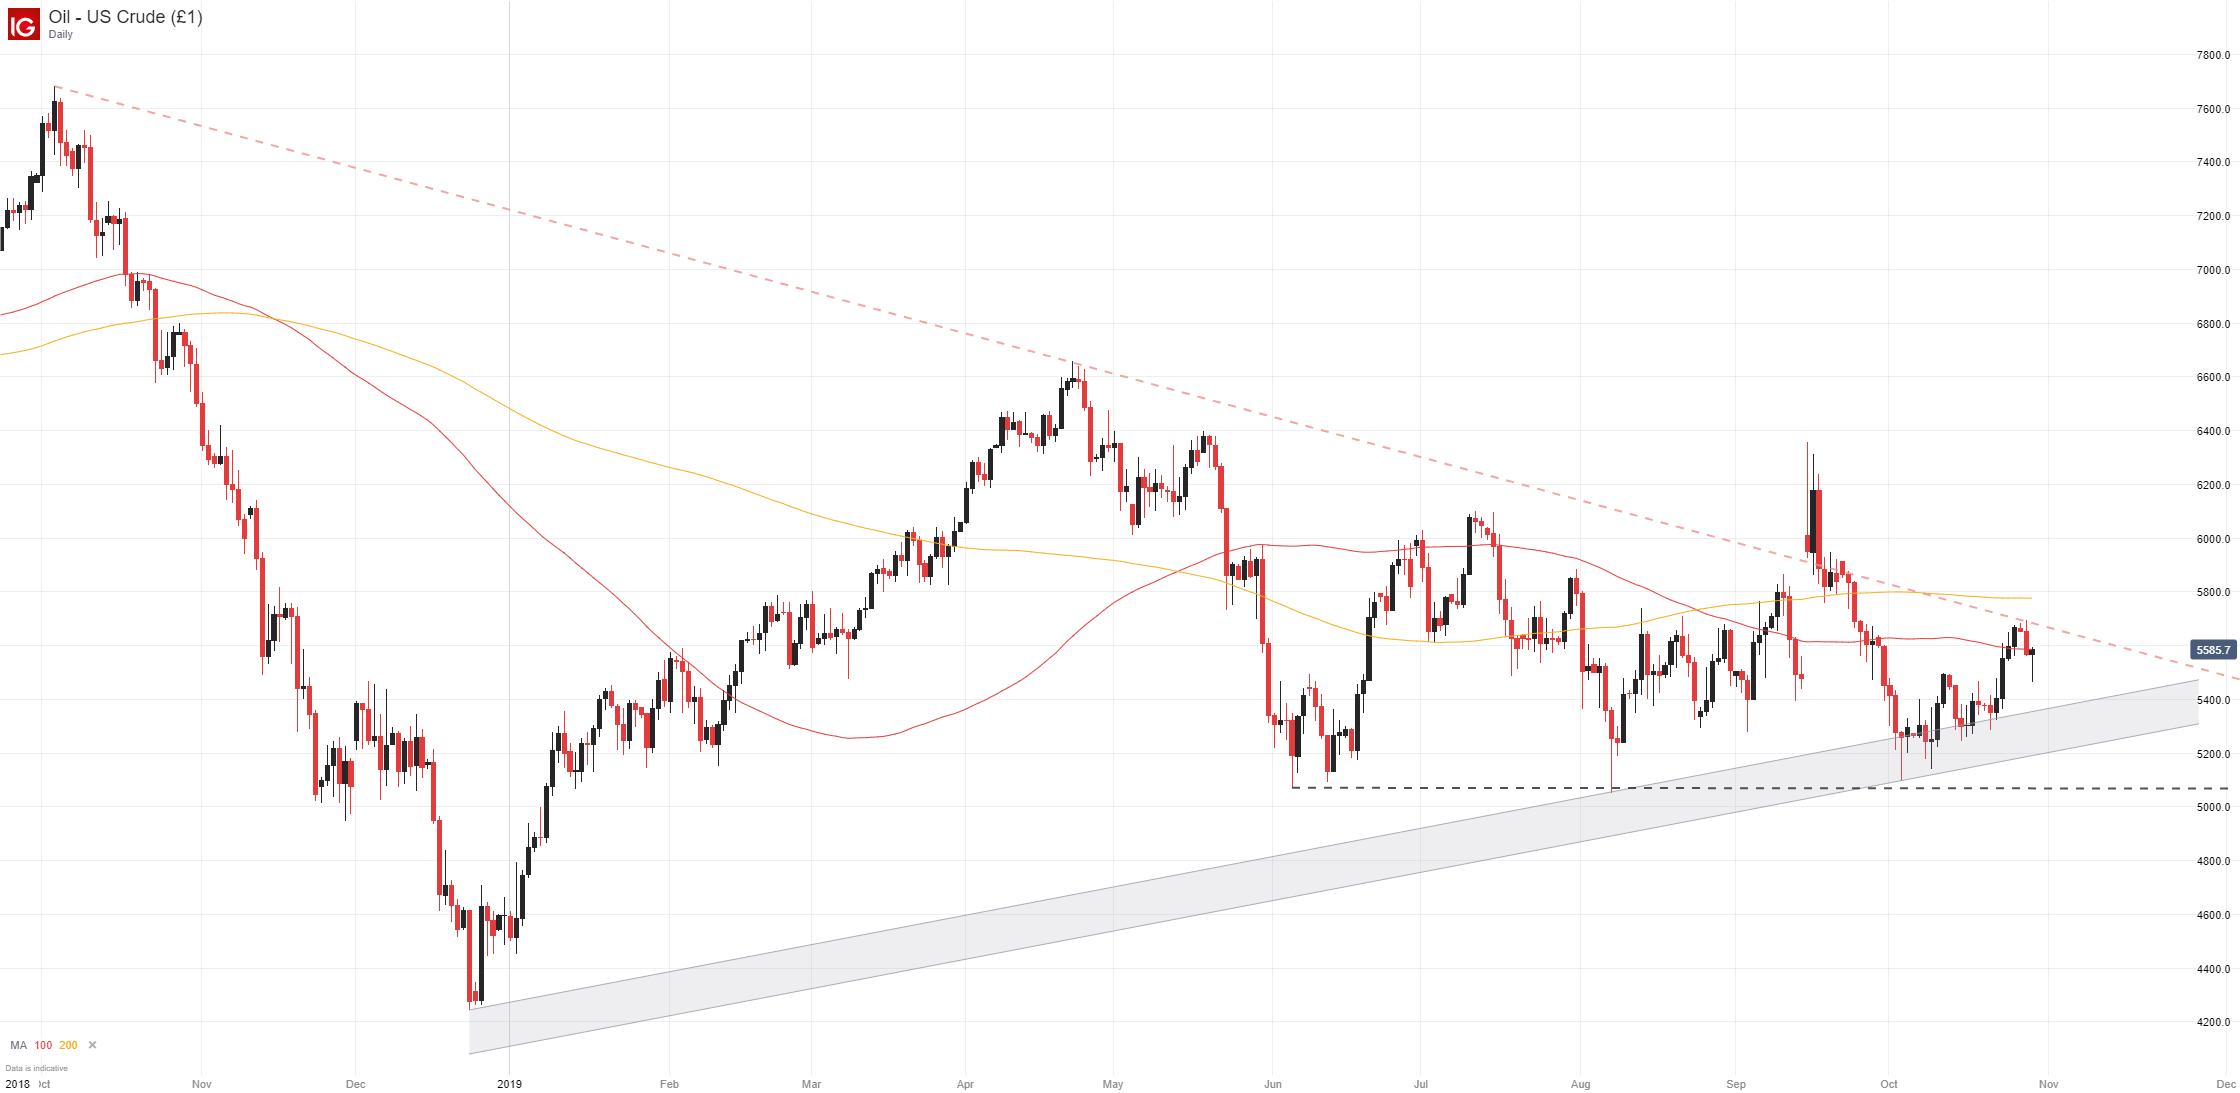
In the meantime, a descending trendline from October 2018 and the 200-day moving average will look to keep crude oil prices under $58. If technical barriers and the fundamental landscape align to push crude lower, initial support will look to reside around an ascending band of support from late 2018. The band precedes horizontal support around $51 which has helped buoy prices since June. Further, IG client positioning suggests crude prices may continue lower.
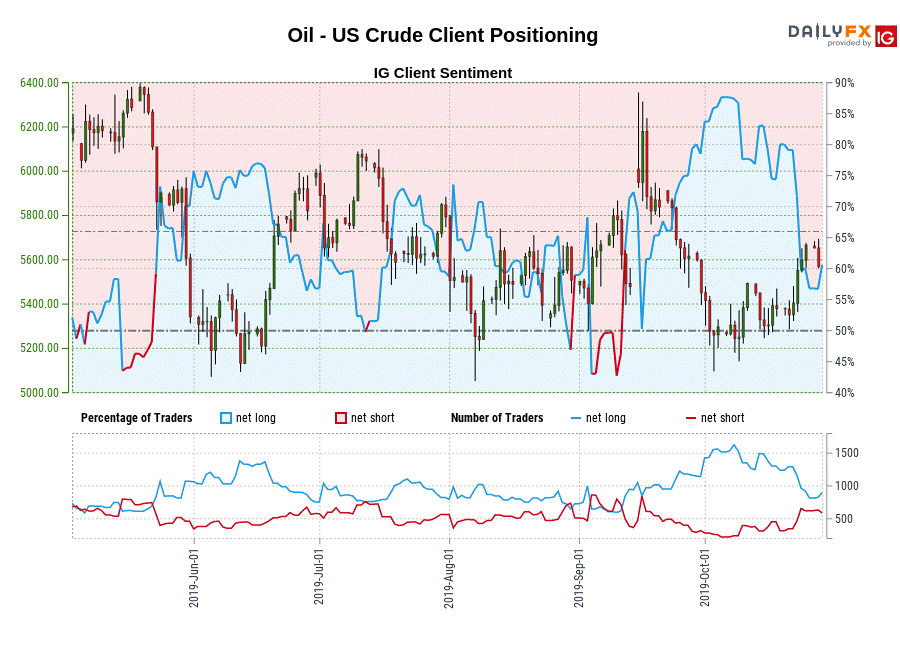
Retail trader data shows 68.36% of traders are net-long with the ratio of traders long to short at 2.16 to 1. The number of traders net-long is 16.82% higher than Monday and 21.45% lower from last week, while the number of traders net-short is 30.34% lower than Monday and 18.58% higher from last week. We typically take a contrarian view to crowd sentiment, and the fact traders are net-long suggests crude oil prices may continue to fall. As the market awaits a crucial Federal Reserve rate decision, follow @PeterHanksFX on Twitter for further updates and analysis.
--Written by Peter Hanks, Junior Analyst for DailyFX.com
Contact and follow Peter on Twitter @PeterHanksFX
Read more: Amazon Earnings and Consumer Appetite, Will Trade Wars Steal Christmas?


