


S&P 500, DAX, FTSE 100 Price Analysis & News
- S&P 500 | Holding Tight Range
- DAX | Hitting Fresh 2019 Peak
- FTSE 100 | Key Support Lifts Index Higher
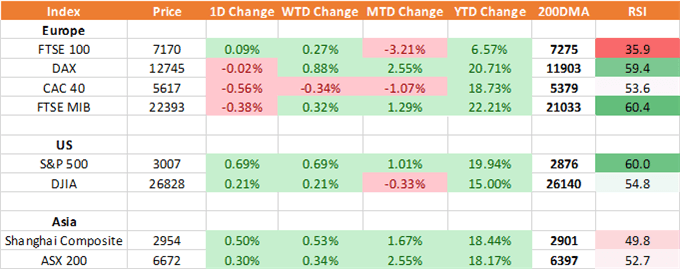
Source: Refinitiv, DailyFX
S&P 500 | Relatively tight range for US equities with the S&P 500 continuing to oscillate around the 3000 level, continuing to reflect that sentiment remains subdued with markets neither significantly risk on or risk off. The initial lift in the S&P 500 overnight had stemmed from the PBoC’s liquidity injection of CNY 250bln, which marked the largest injection of liquidity since late May. However, the entirety of those gains has been pared throughout the European session. Looking ahead, much of the focus will be on Thursday’s session with the next set of global PMIs due to be released, alongside the latest ECB monetary policy decision. On the technical front, topside resistance resides at 3016-2028, while support in the short term sits at 2976 (Oct 18th low)
S&P 500 Price Chart: Daily Time Frame (Jan 19 – Oct 19)
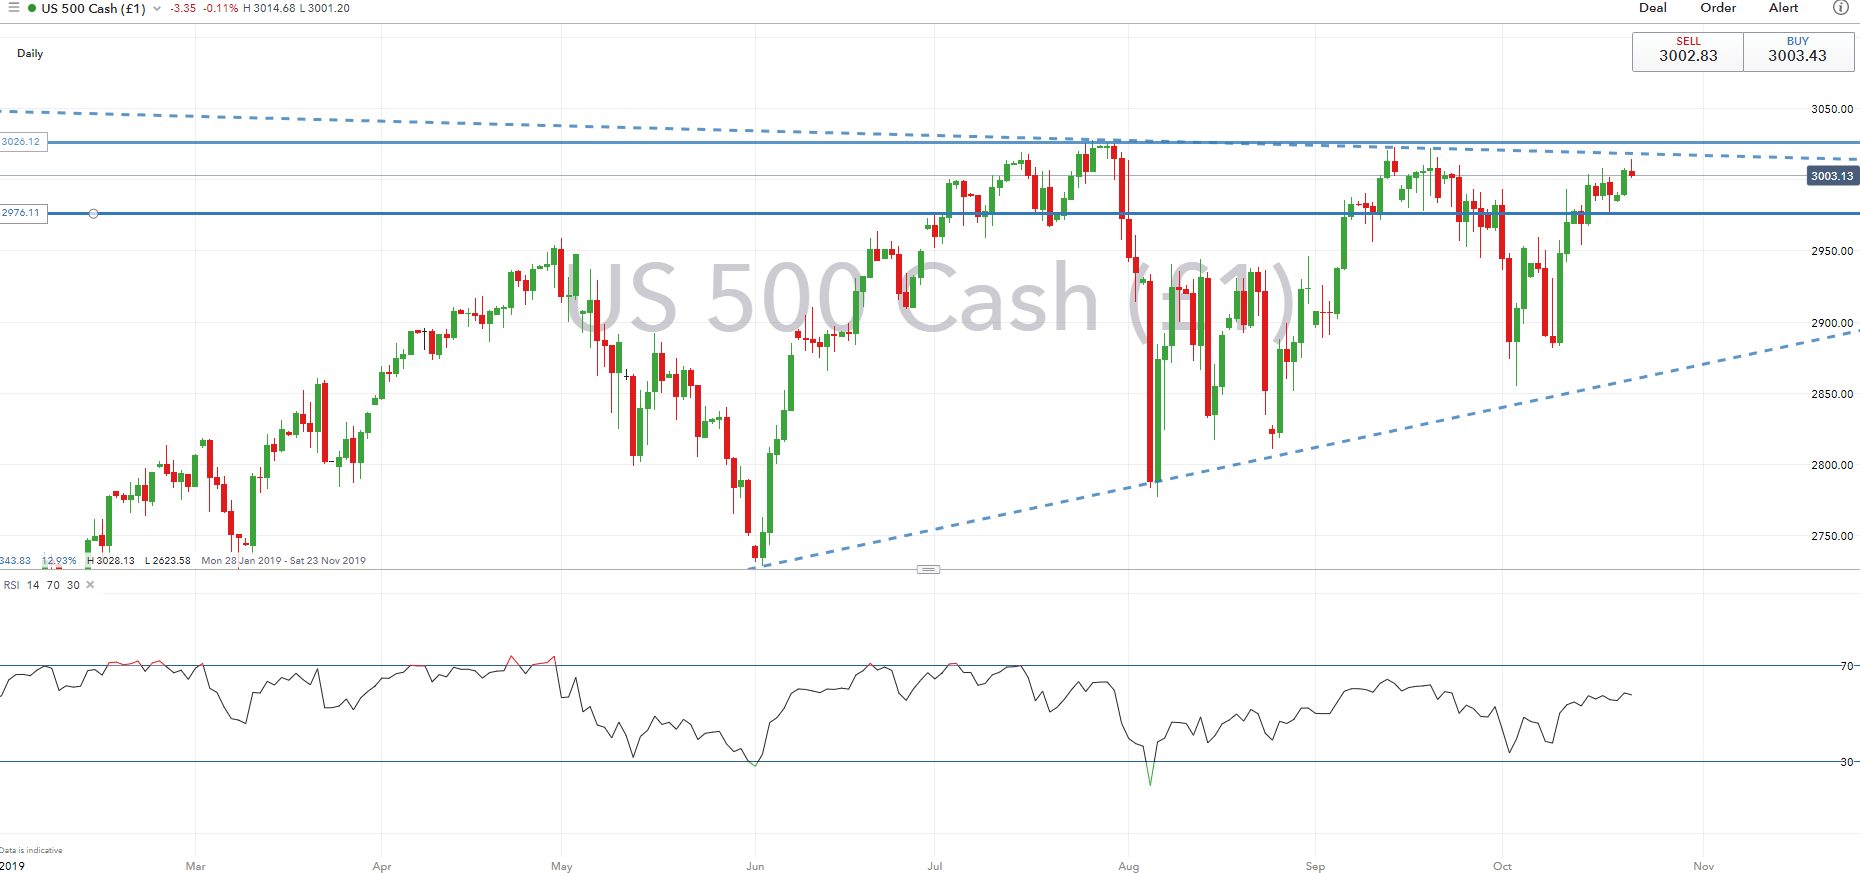
Source: IG Charts
US Earnings Season Kicks into High Gear
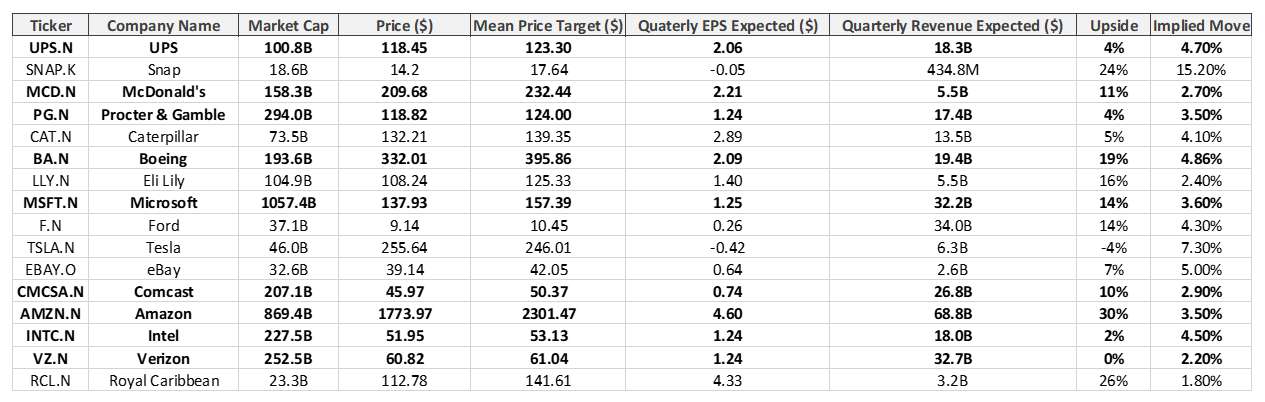
Source: Refinitiv, Bloomberg, DailyFX
DAX | The DAX is currently trading at its best level since August 2018 amid the reduction in uncertainty pertaining to Brexit and US-China trade wars. Consequently, the index has extended on its gains following the break above the descending trendline, however, resistance at 76.4% Fibonacci retracement of the 13601-10173 decline has remained firm thus far. That said, a closing break may pave the way for a move towards the 13000 level. However, keep in mind that the relative strength index is showing a negative divergence, which in turn signals that the recent move in the DAX may be somewhat exhausted, therefore raising the risk of a potential pullback.
DAX Price Chart: Daily Time Frame (Jan 2018 – Oct 2019)

Source: IG Charts
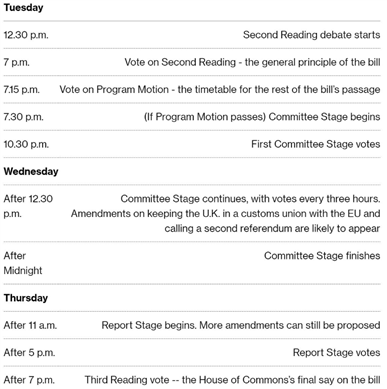
FTSE 100 |Once again the index bounces off the rising trendline, while a slight dip in the Pound has also seen the FTSE 100 outperform its counterparts throughout the European morning. However, all eyes among those with exposure to UK assets will be predominantly focused on the outcome of today’s vote on the Withdrawal Agreement Bill. As it stands, the BBC Political Editor has signaled that UK PM Johnson may have enough support to get the WAB through parliament.
Technically, further upside in the FTSE 100 remains somewhat limited above the 38.2% Fibonacci retracement, while the 200DMA also sits at 7275. However, short direction in the FTSE 100 is very much predicated on the Brexit outcome.
Source: Bloomberg
FTSE 100 Price Chart: Daily Time Frame (Nov 2018 – Oct 2019)

Source: IG Charts
--- Written by Justin McQueen, Market Analyst
To contact Justin, email him at Justin.mcqueen@ig.com
Follow Justin on Twitter @JMcQueenFX


