


Gold (XAU) Price, Charts and Analysis
Q3 2019 Gold Forecast and Top Trading Opportunities
Gold (XAU) Bounces Back on Growing Recession Fears
The price of gold has moved back to the $1,500/oz. level after hitting a mid-week low of $1,460/oz. as global recession fears continue to spook the market. Equity took the brunt of the sentiment shift, while risk-on currencies – AUS, NZD and CAD - were also hammered lower. The recent US ISM manufacturing print hit a decade low, adding fuel to the recent risk-off move, while Wednesday’s WTO ruling that the US can impose tariffs on USD7.5 billion of EU goods has heightened fears of further trade war disruptions.
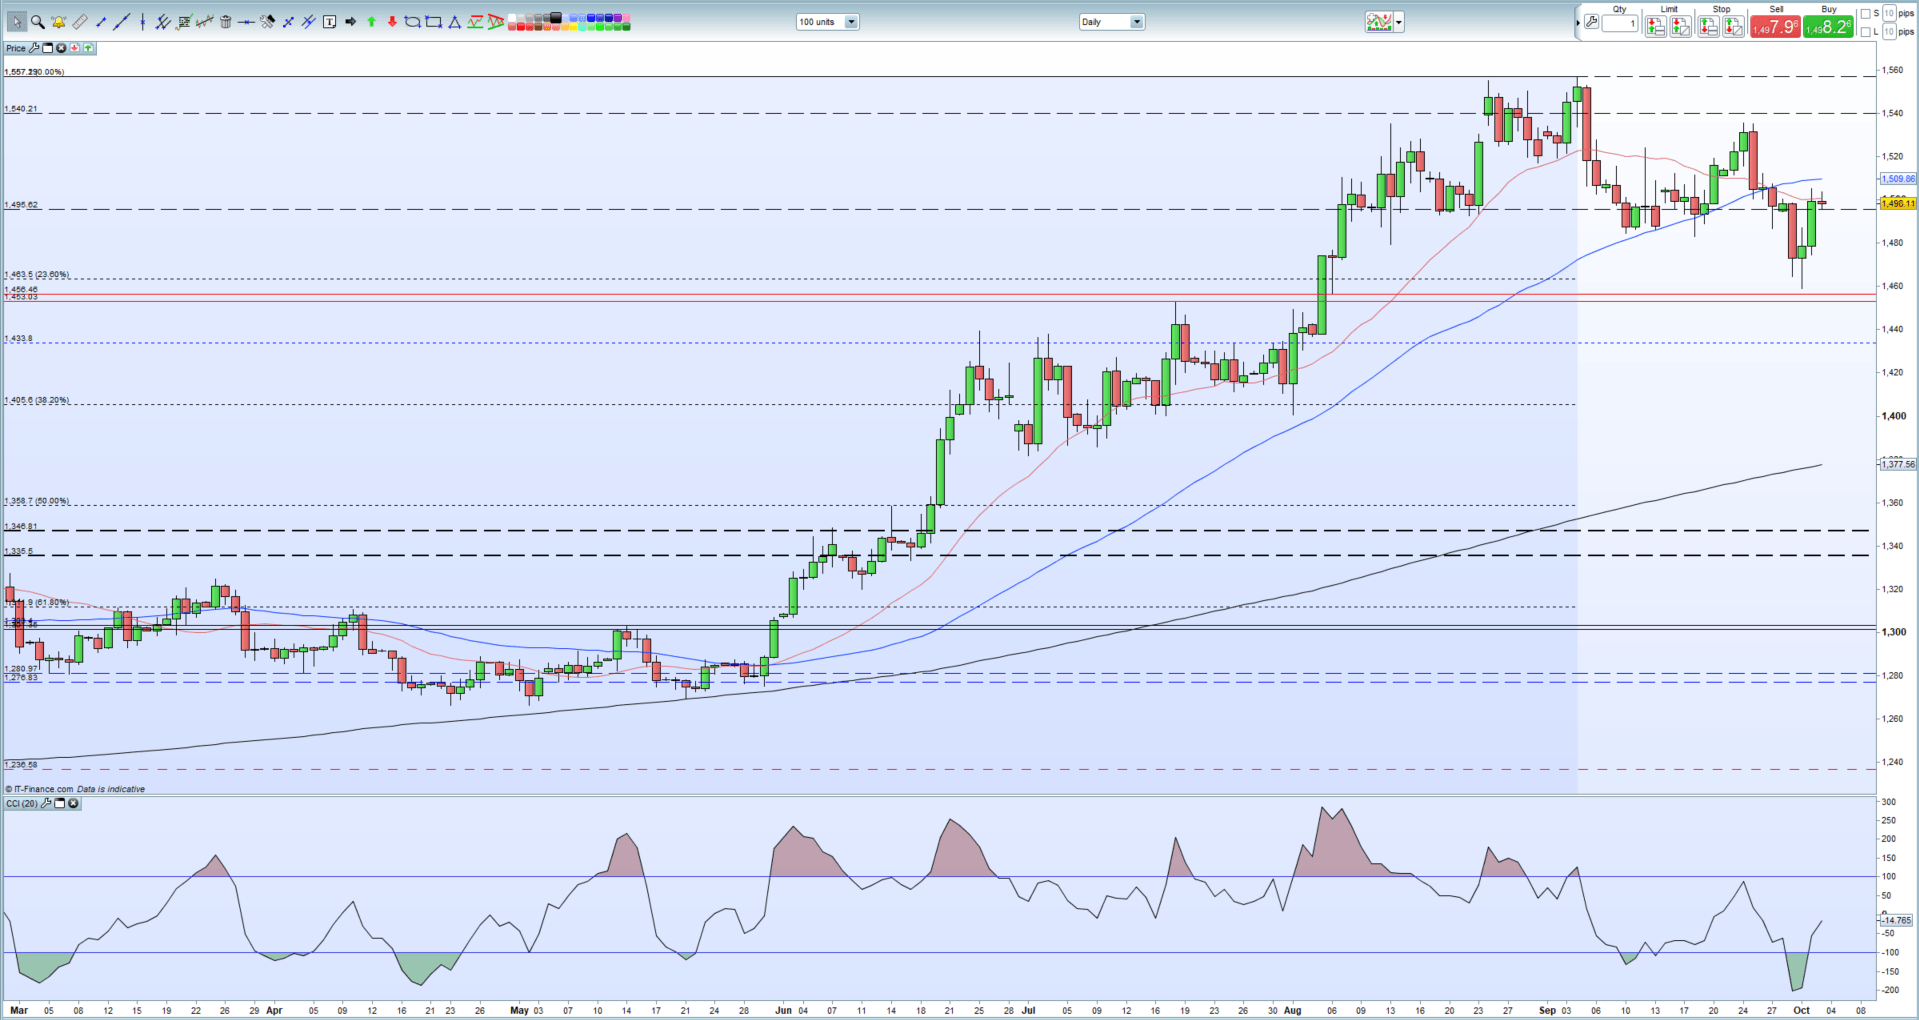
Gold is marking time either side of $1,500/oz. and the 20-day moving average, with a cluster of lows between $1,485/oz. and $1,495/oz. providing a zone of support. Below here there is support off the 23.6% Fibonacci retracement level at $1,463.5/oz. To the upside, $1,510 - $1,512/oz. is the first level of resistance gold needs to overcome before $1,536/oz. comes into play. Gold will need to close above this level to break the recent downtrend pattern and set itself up for a run at the recent six-and-a-half high at $1,557/oz.
Gold Price Daily Chart (March – October 3, 2019)
IG Client Sentiment data show that 65.0% of retail traders are net-long of gold, a bearish contrarian indicator. See how daily and weekly shifts in positioning change trader sentiment.
Live Data Coverage: US Non-Farm Payrolls - Webinar – Friday 12.15 GMT
How to Trade Gold: Top Gold Trading Strategies and Tips
Traders may be interested in two of our trading guides – Traits of Successful Traders and Top Trading Lessons – while technical analysts are likely to be interested in our latest Elliott Wave Guide.
What is your view on Gold – bullish or bearish?? You can let us know via the form at the end of this piece or you can contact the author at nicholas.cawley@ig.com or via Twitter @nickcawley1.


