


EUR/USD Price Charts and Analysis:
- EUR/USD chart remains negative but oversold signal flashing.
- A complete re-trace back to 1.0340 may occur.
Q3 2019 EUR and USD Forecasts and Top Trading Opportunities
EUR/USD Sell-Off Continues as 1.0900 Nears
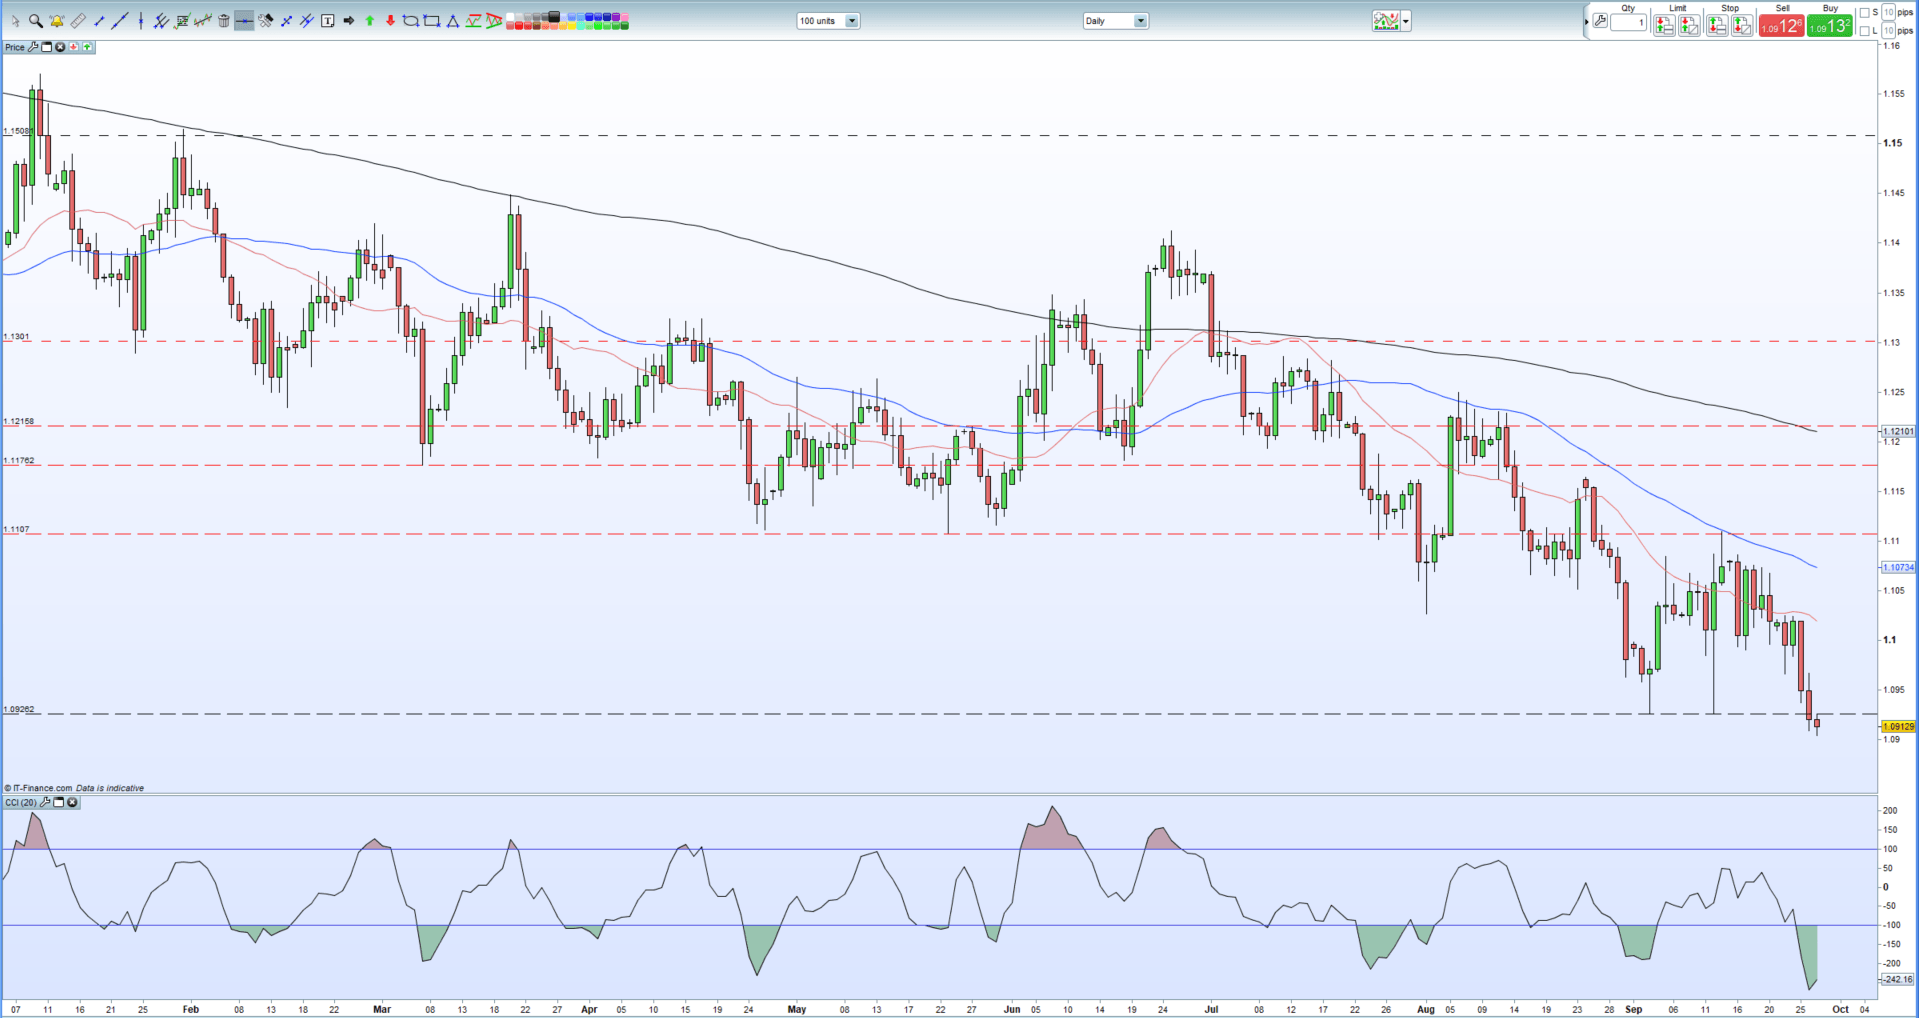
The technical set-up for EURUSD remains negative with the daily chart dominated by lower highs and lower lows, while the pair opened below the recent double-low support at 1.0926, another negative signal. The pair now trade at lows last seen in May 2017 and if the ‘big figure’ support at 1.0900 breaks shortly, then expect prices to drift lower. EURUSD trades below all three moving averages but the pair is extremely oversold, according to the CCI indicator, which may slow-down any further sell-off. To the upside, resistance is expected around 1.1020 to 1.1025, a combination of recent highs and the 20-day moving average.
The move lower in EURUSD is not just based on Euro weakness. The US dollar continues to rally with the USD basket (DXY) nearing a 29-month high as demand for the greenback remains healthy. Later in the session there are two important US data releases, durable goods (August) and the Fed’s favored inflation indicator, core PCE. Inflation is expected to remain at 0.2% on a monthly basis while year-on-year a rise to 1.8% from 1.6% is seen.
EUR/USD Support Under Heavy Pressure, Eyes a Gap Lower Down
EURSUD Price Daily Chart (January – September 27, 2019)
A look at the weekly chart shows there is little in the way of strong support on the way down. There is a gap created on the weekly chart in mid- to late-April 2017 between 1.0777 and 1.0820 which is likely to be targeted, before old lower highs at 1.0569 and 1.0494 come into view. After this a complete re-trace to 1.0340 is likely.
EURUSD Weekly Price Chart (January 2017 – September 27, 2019)

The IG Client Sentiment Indicator shows retail traders are 72.0% net-long of EURUSD, a bearish contrarian bias.
Traders may be interested in two of our trading guides – Traits of Successful Traders and Top Trading Lessons – while technical analysts are likely to be interested in our latest Elliott Wave Guide.
What is your view on the Euro – bullish or bearish?? You can let us know via the form at the end of this piece or you can contact the author at nicholas.cawley@ig.com or via Twitter @nickcawley1.


