


Gold (XAU) Price, Silver Price (XAG) Analysis and Chart
- Gold continues its post-FOMC rally, powered by a fresh risk-off bid.
- Silver needs to break resistance for move to continue.
Q3 2019 Gold Forecast and Top Trading Opportunities
Gold Up $60 since FOMC Decision, US-China Trade Wars Drive the Move
The price of gold is up around 4% since last week’s FOMC decision and today’s move is being fueled by a ratcheting up of trade tensions between the US and China which has sparked a global risk-off move. US President Donald Trump turned up the pressure on China last week by slapping a 10% tariff on $300 billion of Chinese imports, in addition to the 25% on $250 billion of Chinese goods already in effect. In retaliation, China has let USDCNH weaken above 7.00, to counteract the tariffs, a move that will infuriate the US and may bring further punitive action.
The daily gold chart continues to look positive but is also flashing a strong overbought signal which may temper any further short-term rally. Gold broke above the recent six-year high at $1,453/oz. and a close and consolidation above this level will bring the May 2013 high of $1,488/oz. into view before $1,551/oz. comes into play. Support seen between $1,433/oz. and $1,437/oz.
The DailyFX Calendar covers all important market moving data releases and events.
Gold Price Daily Chart (January - August 5, 2019)

IG Client Sentiment data show that 62.0% of retail traders are net-long of gold, a bearish contrarian indicator. However, recent daily and weekly positional changes give us a bullish contrarian bias.
How to Trade Gold: Top Gold Trading Strategies and Tips
Silver Held Back by Technical Resistance
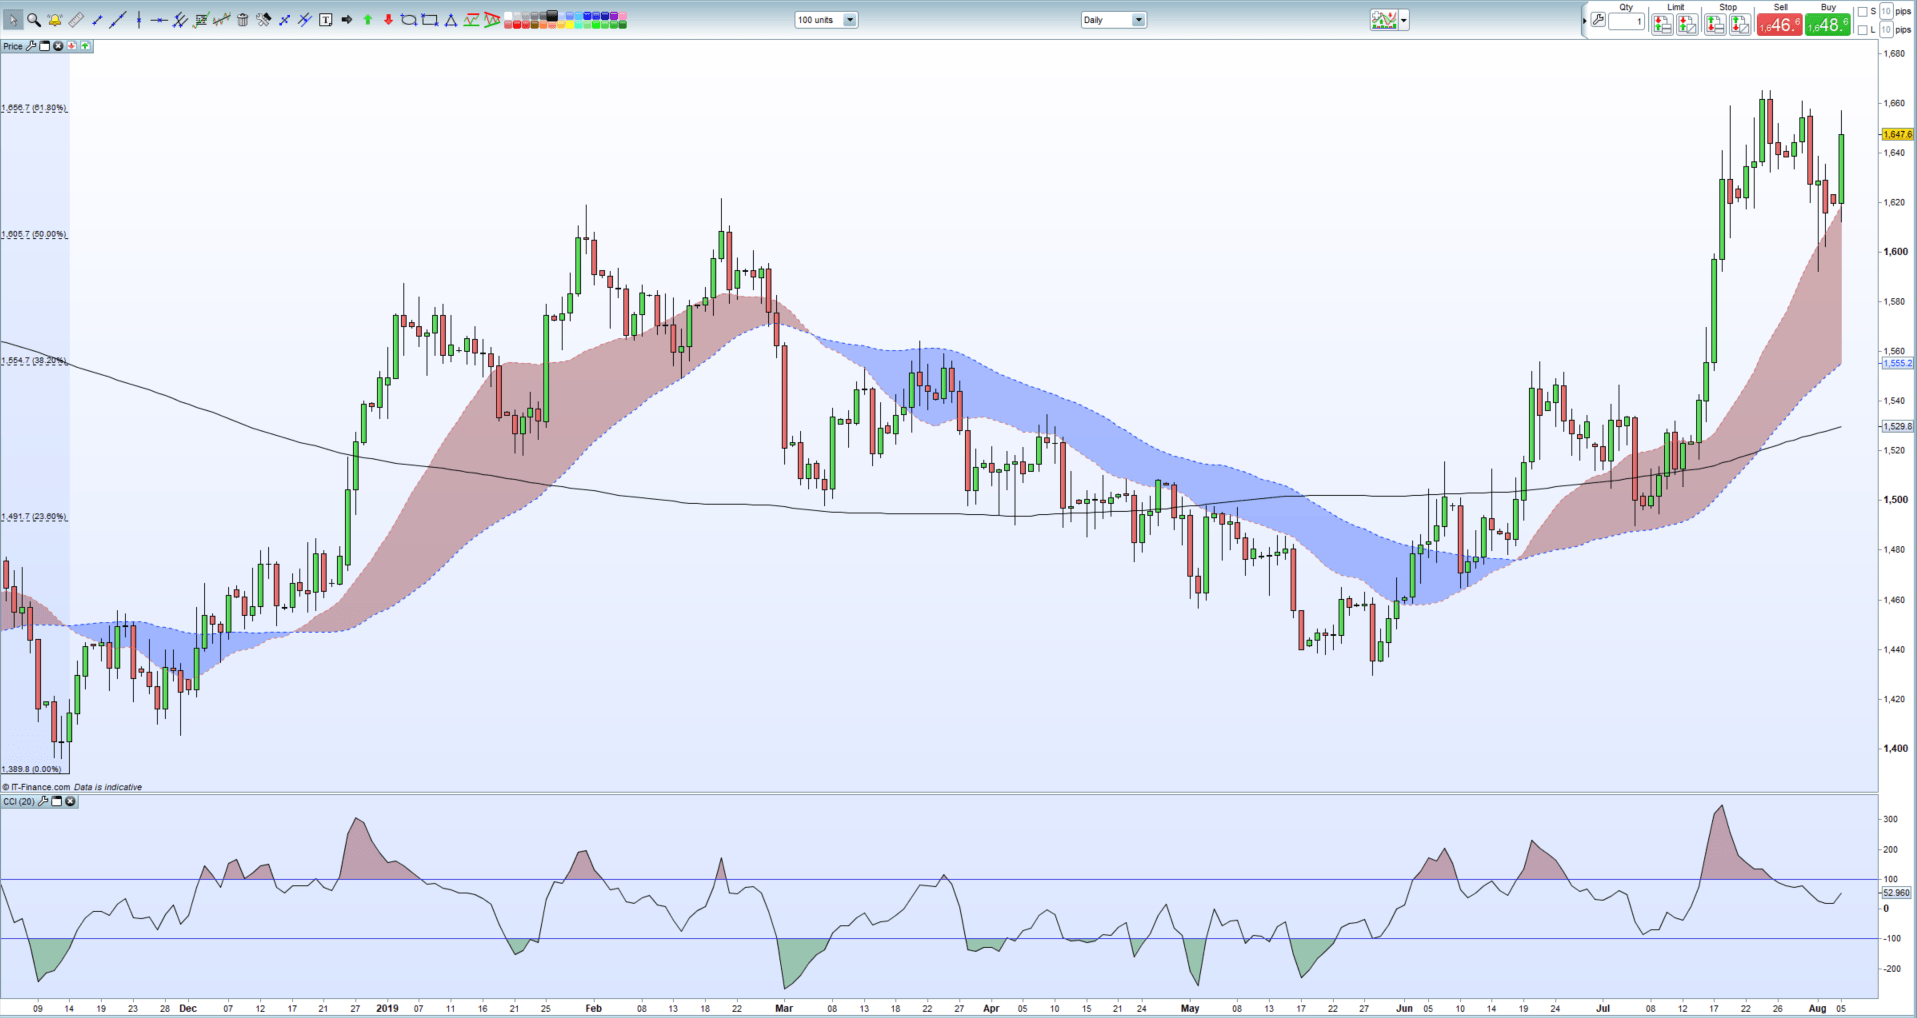
Silver’s recent sell-off has been reversed and is now looking at breaking back above recent highs and an important Fibonacci retracement level. The recent double-high at $16.65/oz. is guarded by the 61.8% retracement level at $16.57/oz. with two other intra-day highs in-between. Silver needs a break and close above $16.65/oz. before it can re-test the June 14, 2018 swing-high at $17.32/oz. A cluster of lows between $16.12/oz. and $16.17/oz. provides support.
Silver Daily Price Chart (November 2018 – August 5, 2019)
How to Trade Silver: Top Trading Strategies
Traders may be interested in two of our trading guides – Traits of Successful Traders and Top Trading Lessons – while technical analysts are likely to be interested in our latest Elliott Wave Guide.
What is your view on Gold and Silver – bullish or bearish?? You can let us know via the form at the end of this piece or you can contact the author at nicholas.cawley@ig.com or via Twitter @nickcawley1.


