


EURUSD Price, Chart and Analysis:
- Fed and ECB monetary policy turning dovish.
- EURUSD triangular breakout on the cards in the coming days.
Q3 2019 EUR Forecast and USD Top Trading Opportunities and Forecasts
Keep up to date with all key economic data and event releases via the DailyFX Economic Calendar
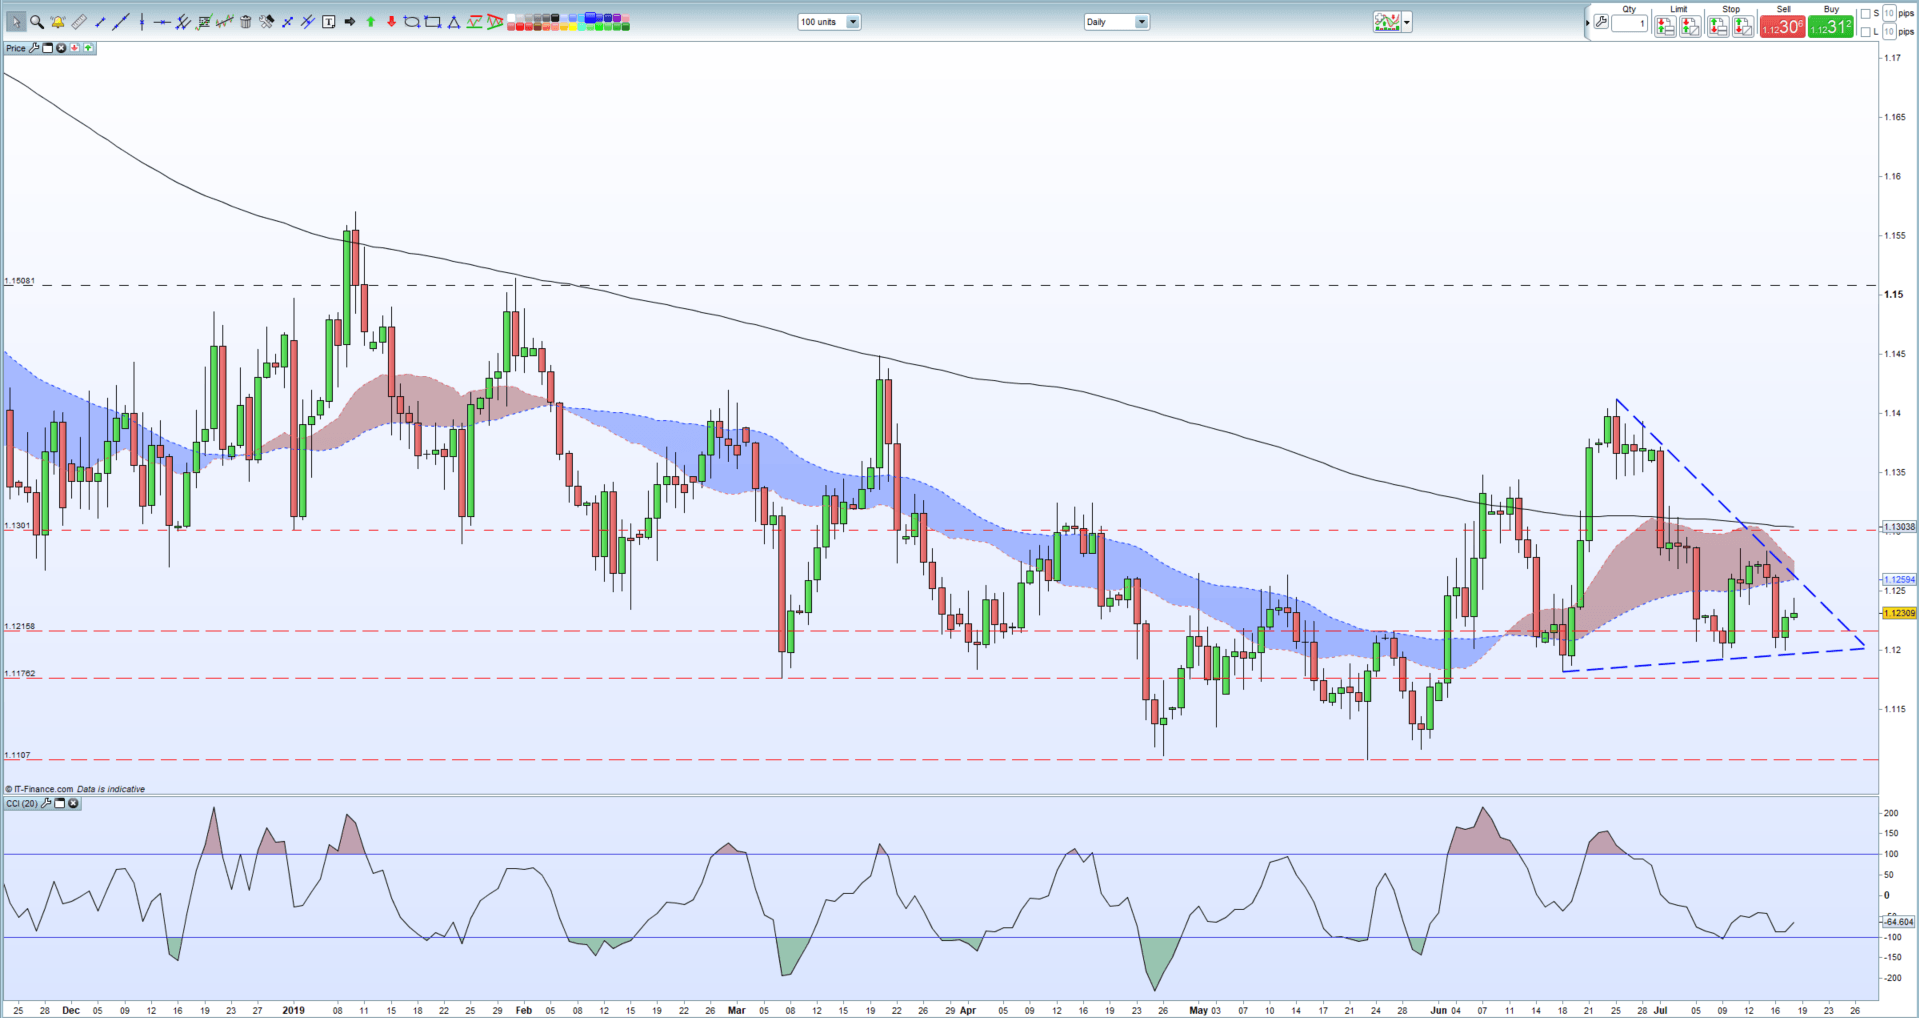
EURUSD price action is currently setting up for a triangular breakout ahead of two important central bank meetings this month. The triangle’s vertex, defined by higher lows and lower highs, falls due around the time of the next ECB meeting on July 25 where the central bank is expected to outline a potential 10 basis point cut to the deposit rate to -0.5%. ECB President Mario Draghi may also prepare the market for another round of quantitative easing (bond buying), especially if economic data remains weak.
In the US, the FOMC meeting on July 31 is fully expected to result in a 0.25% interest rate cut as Fed chair Jerome Powell looks to head off any economic slowdown. While interest rate cuts in the US have now been priced in over the last 2-3 months, the realization that the ECB has changed course and now needs to provide fresh monetary stimulus has weakened the Euro and may well weaken it further in the coming months.
On the daily chart the triangular set-up over the last few is clear. The floor is currently a few pips under 1.1200, while the spot price is currently 1.1230 and falling. A break and close below 1.1182 would negate the short-term series of higher lows from June 18, while a bearish chart breakdown will need a close below the May 23 low at 1.1107.
ECB to Continue QE as Fed Cements its Case for an Interest Rate Cut
EURUSD Daily Price Chart (November 2018 – July 18, 2019)
Retail traders are 66.6% (!!!) net-long EURUSD according to the latest IG Client Sentiment Data, a bullish contrarian indicator. However recent daily and weekly positional changes give us a stronger bearish contrarian trading bias.
We run several Trader Sentiment Webinars every week explaining how to use IG client sentiment data and positioning when looking attrade set-ups. Access the DailyFX Webinar Calendar to get all the times and links for a wide range of webinars.
Traders may be interested in two of our trading guides – Traits of Successful Traders and Top Trading Lessons – while technical analysts are likely to be interested in our latest Elliott Wave Guide.
What is your view on EURUSD – bullish or bearish? You can let us know via the form at the end of this piece or you can contact the author at nicholas.cawley@ig.com or via Twitter @nickcawley1.


