


Gold Price Analysis and Talking Points:
- Gold on Course for Best Week Since March 2018
- NFP Report in Focus
- Technical Outlook | Key Trendline Resistance Remains Formidable
See our quarterly gold forecast to learn what will drive prices throughout Q2!
Gold on Course for Best Week Since March 2018
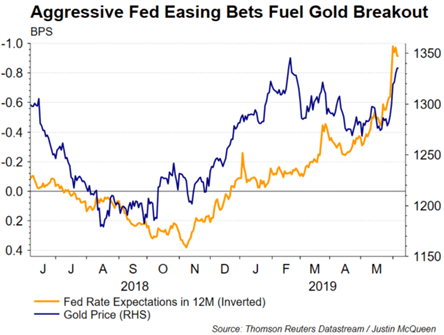
Amid the backdrop of raised expectations that the Federal Reserve will provide “insurance” rate cuts to insulate the US economy from adverse external events, gold prices have soared through $1300 to move within touching distance of the 2019 peak. Last week we highlighted that risks were tilted to gold upside on fueling rate cut bets (full story) after Fed Vice Chair Clarida’s statement in which he had seemingly opened the door to a rate cut. Since then, a raft of Fed rate setters had signaled their openness to a easing with Chairman Powell noting that policy could be adjusted in order to sustain the expansion, while Bullard was perhaps the most explicit having stated that a rate cut could be warranted soon.
Alongside this, the trade war backdrop has also provided underlying support for the precious metal. However, in the near term, focus will be on the outcome of the US and Mexican trade discussions this weekend as recent headlines suggest that tariffs on Mexican goods could be delayed thus potentially taking the shine of some of golds recent rally if indeed this was to be the case.
NFP Report in Focus
Today’s focus will lie on the US jobs report, particularly after the weakest ADP reading in 9yrs. Although, to put some context on the ADP report, typically the correlation between that and NFP is relatively weak, while the 3-month average is a rather robust 153k with the 2019 average at 188k. Alongside this, the ISM employment index had been notably firmer, which tends to be more important for NFP. Elsewhere, the wage component remains the most important metric within the report as Fed officials look for inflationary signs.
Technical Outlook | Key Trendline Resistance Remains Formidable
While gold prices have soared, questions can be raised on whether the precious metal has moved too much in such a short space of time. As such, with gold now eying critical resistance in the form of the descending trendline that has held over the past 5yrs, there is a risk of a slight pullback.
GOLD PRICE CHART: Daily Time-Frame (Feb 2013-June 2019)

What You Need to Know About the Gold Market
GOLD TRADING RESOURCES:
- See our quarterly gold forecast to learn what will drive prices through mid-year!
- Just getting started? See our beginners’ guide for FX traders
- Having trouble with your strategy? Here’s the #1 mistake that traders make
--- Written by Justin McQueen, Market Analyst
To contact Justin, email him at Justin.mcqueen@ig.com
Follow Justin on Twitter @JMcQueenFX


