


AUD price, news and analysis:
- Weakness in the Australian Dollar looks to be gathering speed as traders opt for safe havens amid poor risk sentiment.
- Disappointing data from both Australia and China aren’t helping, with AUD seen as a proxy for the Chinese economy.
Australian Dollar stumbling
AUDUSD looks to be accelerating to the downside as concern about the US-China trade war makes traders wary of riskier assets. Poor data Wednesday from both China and Australia are helping it weaken too, with AUD seen as a proxy for China’s economic wellbeing.
On the trade war front, tensions seem to be easing a tad, with US President Donald Trump tweeting that “when the time is right we will make a deal with China”. However, that prompted only a minor recovery in risk sentiment and did little to help AUD.
AUDUSD Price Chart, Hourly Timeframe (April 24 – May 15, 2019)
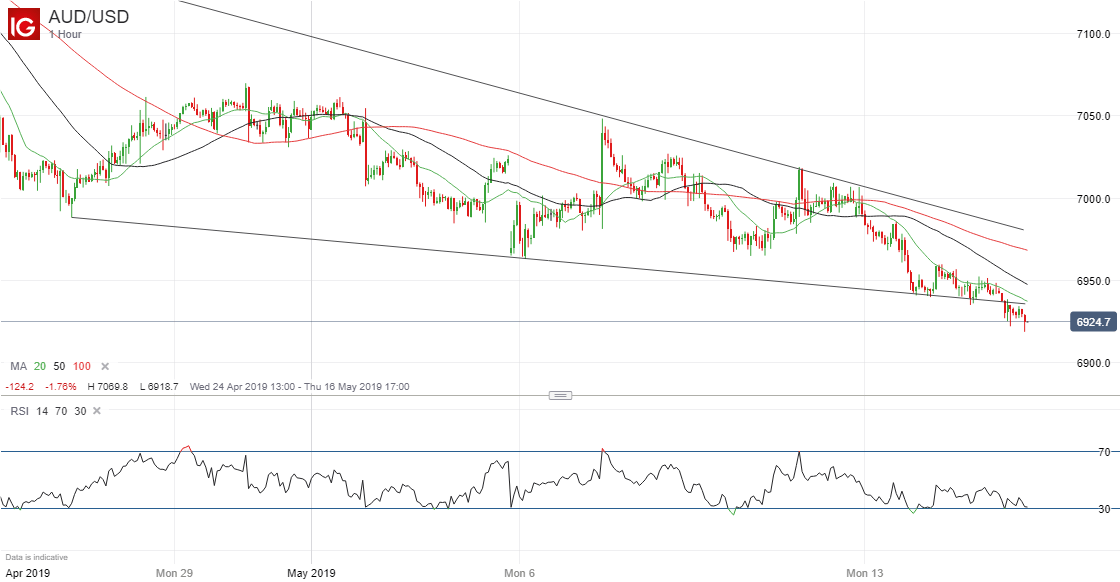
Chart by IG (You can click on it for a larger image)
Moreover, weak retail sales and industrial production figures from China darkened the gloom. Industrial output rose by just 5.4% year/year in April, down from the previous 8.5% and missing economists’ forecasts of a 6.5% increase. Retail sales rose by 7.2% year/year, missing expectations of 8.6% growth and down from the previous 8.7%.
As for Australia itself, the Westpac measure of consumer confidence in May edged up by just 0.6% to 101.3 – a much smaller increase than the 1.9% jump in April although still above the 100 mark that separates optimism from pessimism.
AUDUSD has now fallen to its lowest level since January 3 and, from a technical perspective, looks to be breaking to the downside from a normally-bullish falling wedge chart pattern. AUDJPY looks to be gaining downside momentum too, as JPY strengthens on the continuing demand for havens.
Check out our guide to safe havens and how to trade them here
AUDJPY Price Chart, Hourly Timeframe (April 19 – May 15, 2019)
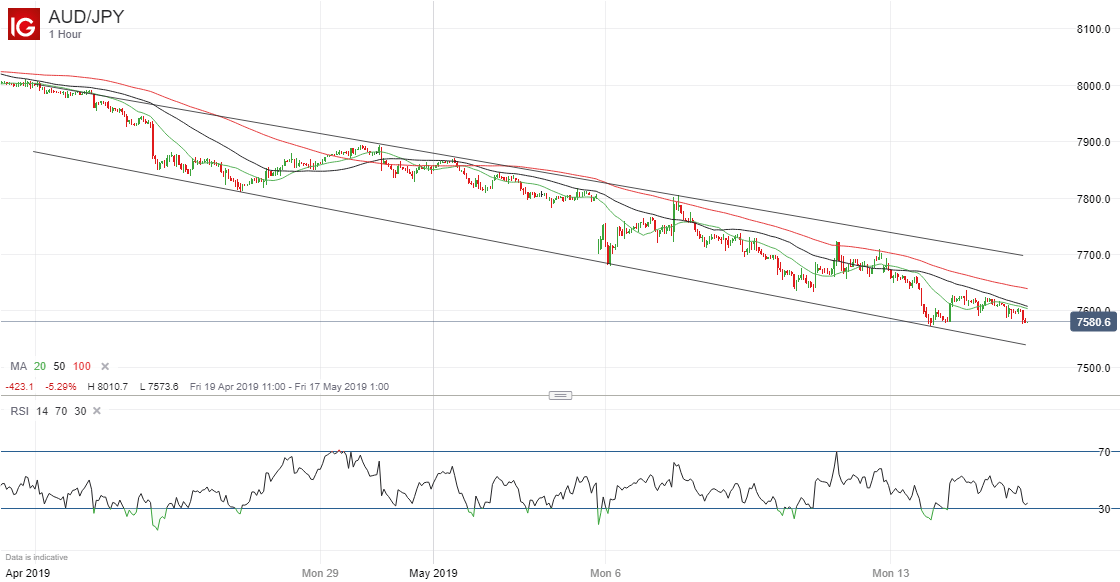
Chart by IG (You can click on it for a larger image)
Resources to help you trade the forex markets:
Whether you are a new or an experienced trader, at DailyFX we have many resources to help you:
- Analytical and educational webinars hosted several times per day,
- Trading guides to help you improve your trading performance,
- A guide specifically for those who are new to forex,
- And you can learn how to trade like an expert by reading our guide to the Traits of Successful Traders.
--- Written by Martin Essex, Analyst and Editor
Feel free to contact me via the comments section below, via email at martin.essex@ig.com or on Twitter @MartinSEssex


