


US-China trade talks, news and analysis:
- Hopes are fading that the US and China will agree this week to end their trade war.
- That is lifting haven assets, which will likely strengthen further if the talks break down.
Trade talk fears damaging market sentiment
Concern is growing in the markets that trade talks this week between the US and China could break down, leading to a flight to haven assets like gold, the Japanese Yen and the notes and bonds issued by the US Treasury. If that is confirmed, more money is likely to flow into them, boosting their prices further.
US President Donald Trump threatened Sunday to levy tariffs on an additional $325 billion of Chinese goods, in addition to the $250 billion of its products already hit by import taxes. He bumped up the rhetoric further Wednesday, saying China “broke the deal” and the Chinese responded by saying they “will not succumb to any pressure”.
That could just be rhetoric ahead of talks Thursday and Friday between the US and Chinese Vice Premier Liu He in Washington but a breakthrough still seems unlikely.
US-China trade war: intellectual property at heart of dispute
Gold and Japanese Yen benefit
So far, the principal beneficiaries of the flight to safety have been gold, the Japanese Yen and the government notes and bonds issued by the US and Germany. While risk appetite could increase if a deal is done, it now seems more likely that the talks will stall, decreasing the attraction of riskier assets like stocks.
Japanese Yen winning the safe haven battle vs USD and gold
Gold Price Chart, Daily Timeframe (November 14, 2018 – May 9, 2019)

Chart by IG (You can click on it for a larger image)
As the chart above shows, the gold price looks currently to be pausing for breath before potentially extending this year’s gains. However, the Japanese Yen is still advancing strongly against the risk-on Australian Dollar, which is seen in the markets as a proxy for China, and AUDJPY could yet lose more ground.
AUDJPY Price Chart, Daily Timeframe (January 10 – May 9, 2019)
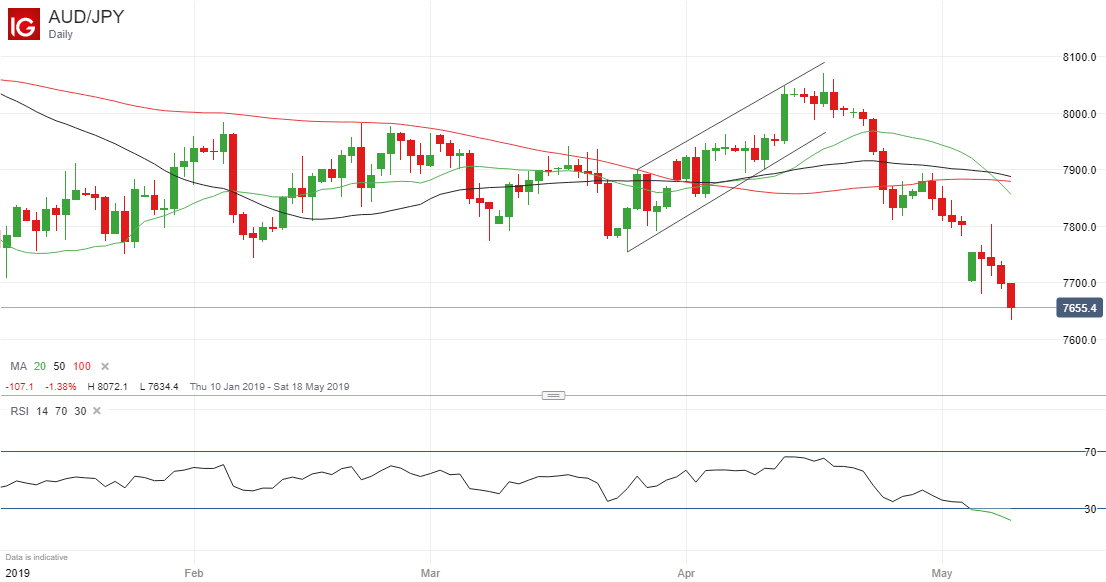
Chart by IG (You can click on it for a larger image)
As for US Treasuries, the yield curve looks close to inverting again, seen by some as a sign of economic weakness ahead. With the trade war raising growth concerns, the three-month yield, at 2.428%, is now only just below the 10-year yield of 2.449%.
US Yield Curve (May 9, 2019)

Source: Investing.com
More to read:
Why a US yield curve inversion matters
How to trade gold: top trading strategies and tips
Resources to help you trade the forex markets:
Whether you are a new or an experienced trader, at DailyFX we have many resources to help you:
- Analytical and educational webinars hosted several times per day,
- Trading guides to help you improve your trading performance,
- A guide specifically for those who are new to forex,
- And you can learn how to trade like an expert by reading our guide to the Traits of Successful Traders.
--- Written by Martin Essex, Analyst and Editor
Feel free to contact me via the comments section below, via email at martin.essex@ig.com or on Twitter @MartinSEssex


