


US stock market volatility analysis:
- Volatility in Wall Street stocks remains close to its highest level since late January as risk aversion sends prices lower in heavy trade.
- The VIX volatility index remains close to the 20 level after rising above 21 on Tuesday.
S&P 500 volatility elevated
The VIX index, which measures the volatility of the S&P 500 index of Wall Street stock prices, jumped to its highest level since late January on Tuesday and is still only just below its highs as concern about the US-China trade talks prompts a flight from high-risk stocks to the relative safety of gold and US Treasury notes and bonds.
VIX Price Chart, (April 8 – May 7, 2019)
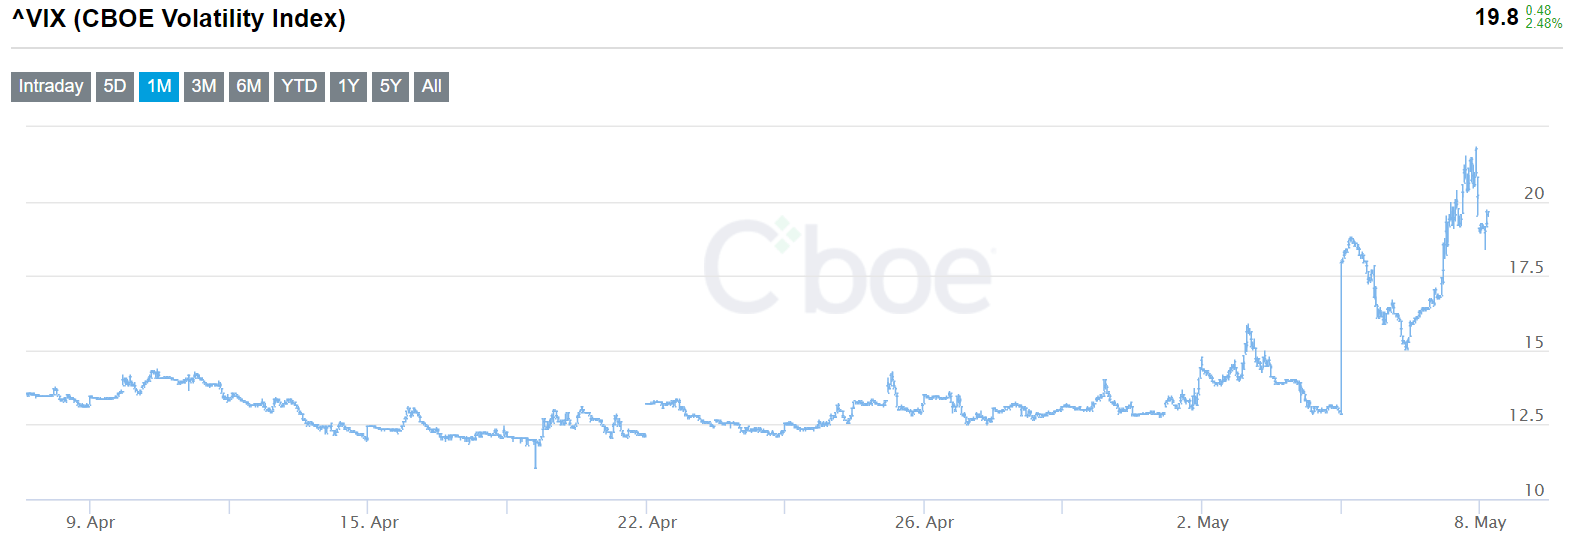
Source: CBOE (you can click on it for a larger image)
The index, which is calculated by the CBOE using the prices of S&P 500 call and put options – and is known as the markets’ “fear gauge” – has jumped in recent days as traders have bailed out of the stock market. Moreover, volume has been high on the downside – a negative signal for prices.
S&P 500 (SPX) Price Chart, Daily Timeframe (February 1 – May 8, 2019)
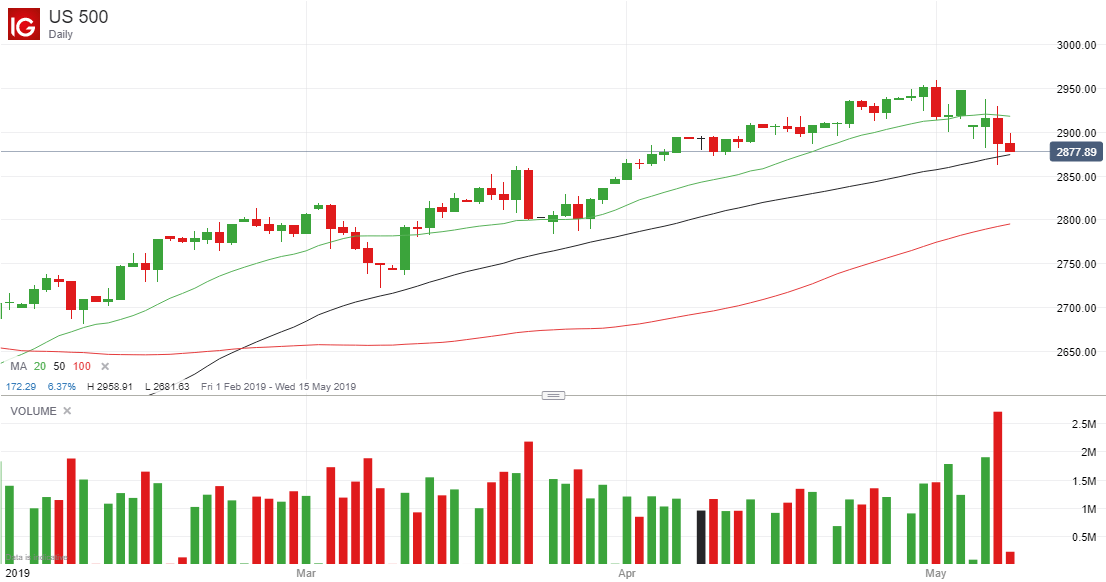
Chart by IG (You can click on it for a larger image)
More to read:
A guide to the S&P 500 VIX index
Resources to help you trade the markets:
Whether you are a new or an experienced trader, at DailyFX we have many resources to help you:
- Analytical and educational webinars hosted several times per day,
- Trading guides to help you improve your trading performance,
- A guide specifically for those who are new to forex,
- And you can learn how to trade like an expert by reading our guide to the Traits of Successful Traders.
--- Written by Martin Essex, Analyst and Editor
Feel free to contact me via the comments section below, via email at martin.essex@ig.com or on Twitter @MartinSEssex


