


Gold (XAU) and Silver (XAG) Price Outlook, Analysis and Charts.
DailyFX Q2 Forecasts and Top 2019 Trading Opportunities.
Gold Price (XAU) Struggles Despite Political Uncertainties
Gold is trading in a very narrow range early Tuesday despite political uncertainty increasing in various regions. The precious metal is normally a ‘go to’ when markets begin to get rattled by major fundamental concerns but, yet, gold has failed to react to US President Trumps’ increasing tariffs on Chinese imports or the news of military movement concerning Iran. One reason that gold is failing to push higher is the weakness in the Chinese Yuan against the US dollar, prompted by further US-China trade tensions. Monday’s sharp jump in USDCNH negated any gold bullish sentiment, but with the pair starting to re-trace, an uptick in gold may be seen.
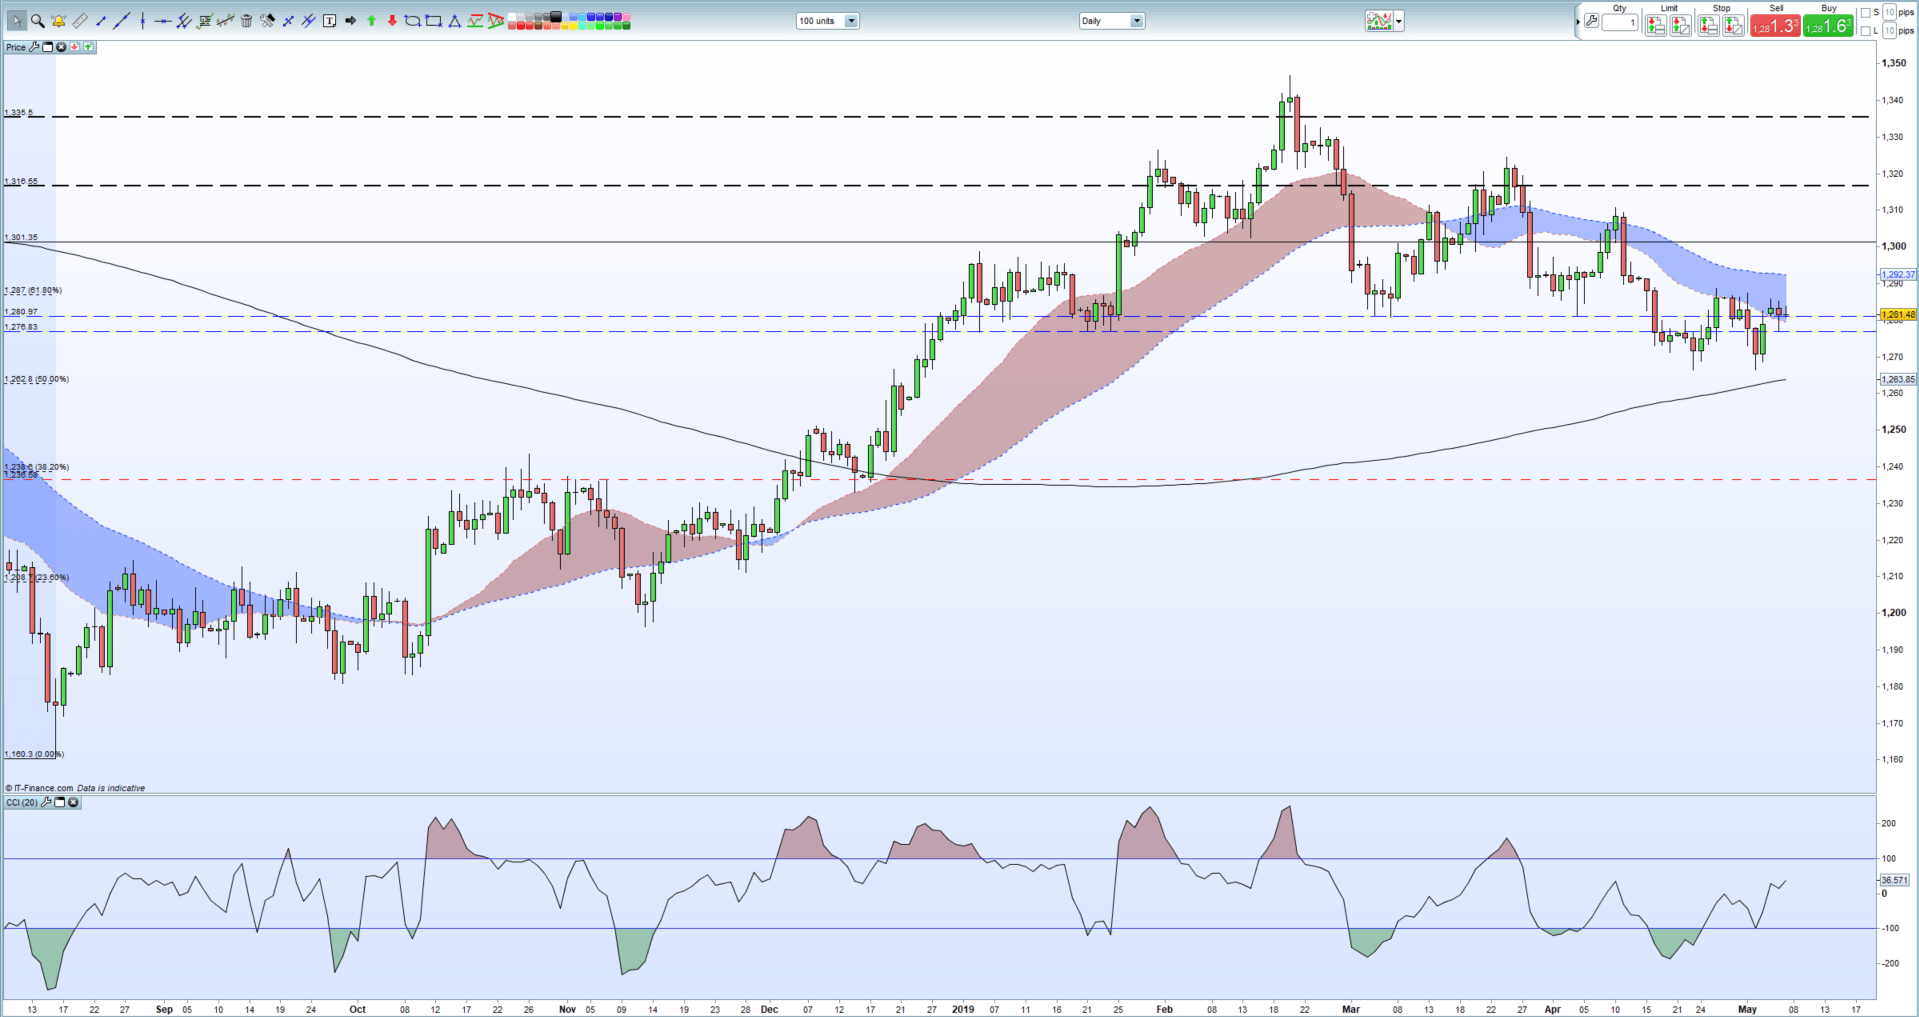
The daily chart shows gold stuck around two old horizontal support levels - $1,276.8/oz. and $1,280.9/oz. - which, while broken recently, have acted as a magnet for the precious metal in the last three weeks. The 200-day moving average is moving gently higher and remains supportive of gold, while the 61.8% Fibonacci retracement level at $1,287/oz. is the first upside level of interest ahead of two rent highs around $1,289/oz.
How to Trade Gold: Top Gold Trading Strategies and Tips
Gold (XAU) Daily Price Chart (August 2018 – May 7, 2019)
Silver Price (XAG) Struggling to Move Higher
Silver is currently struggling to break higher with two technical indicators barring the way higher. Currently trading at $14.87, silver needs to break and close above both 23.6% Fibonacci retracement at $14.92 and the 200-day moving average at $14.99 to spark some bullish momentum. Silver has moved out of oversold territory but recent CCI movement shows that it has struggled over the last six weeks for bullish momentum. The chart also highlights an ongoing pattern of lower highs and lower lows from late-February and this may well continue unless previously mentioned resistance levels are breached.
Silver (XAG) Daily Price Chart (July 2018 - May 7, 2019)

Trading the Gold-Silver Ratio: Strategies and Tips.
IG Client Sentiment shows that retail traders are 75.3% net-long gold, a bearish contrarian indicator. However, recent daily and weekly sentiment shifts give us a stronger bearish contrarian bias.
--- Written by Nick Cawley, Market Analyst
To contact Nick, email him at nicholas.cawley@ig.com
Follow Nick on Twitter @nickcawley1


